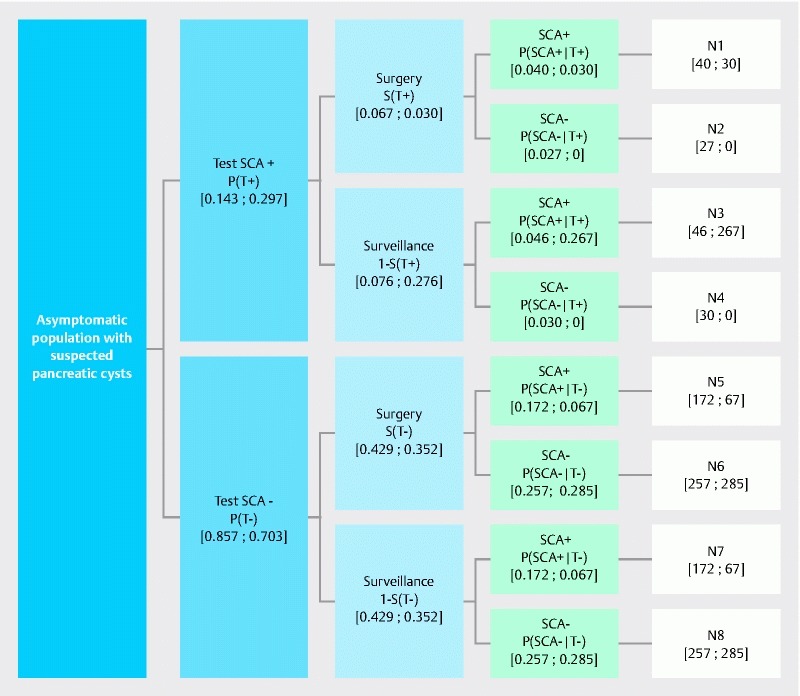
Fig. 1.

Structure of model. (Note: the same model is used for EUS-FNA and EUS-FNA + nCLE; the only differences are the probability values. Values indicated in brackets are the probability values for EUS-FNA and EUS-FNA + nCLE displayed as the following [EUS-FNA; EUS-FNA + nCLE].) Total number of surgical interventions: N1 + N2 + N5 + N6. Number of surgical interventions in patients tested SCA+: N1 + N2. Number of surgical interventions in patients “true” SCA+: N1. Number of surgical interventions in patients tested SCA–: N5 + N6. Number of surgical interventions in patients “true” SCA–: N6.
