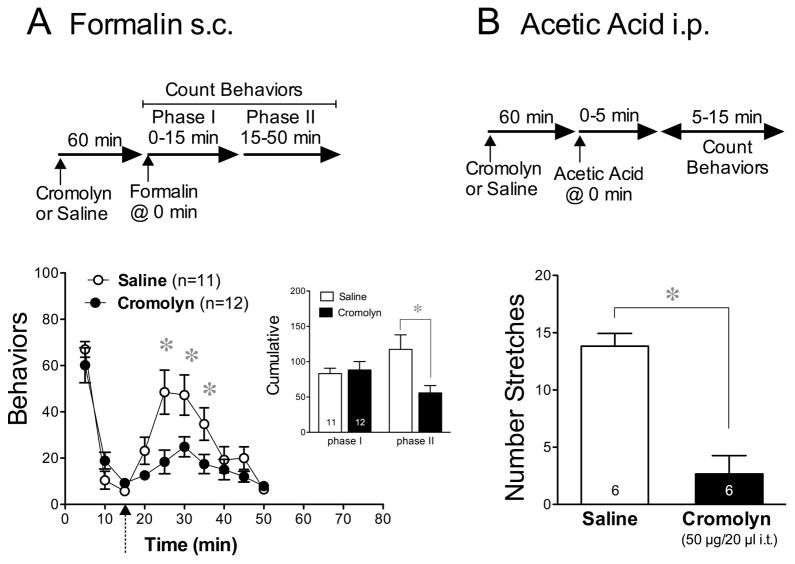
Figure 6.
Effect of cromolyn on chemical nociception induced by formalin and by acetic acid. (A) Time-course of the mean number of nociceptive behaviors in response to formalin (20 μl of 5% s.c.) injected into one hind paw 15 min after an i.t. injection of either cromolyn (50 μg/20 μl) or saline. The insert depicts the mean (±SEM) cumulative number of behavioral responses induced in these groups during phase I compared to phase II. The division between the two phases is indicated on the main graph by the dotted arrow. (B) The mean (±SEM) number of abdominal stretches induced by a 0.3 ml injection of 1% acetic acid delivered i.p. 1 h after an i.t. injection of cromolyn (50 μg/20 μl) or saline. Throughout the panels, differences between treatment groups and between values at each time-interval were determined using an unpaired Student’s t-test.

