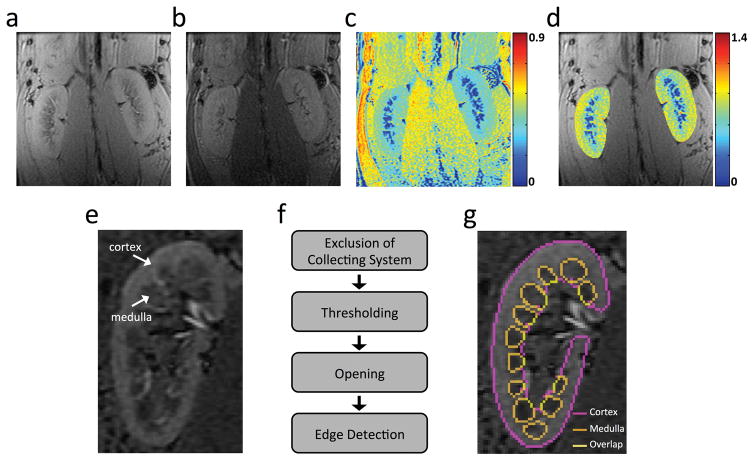
Figure 2. In vivo MTI and kidney segmentation.
(a–c) Representative M0 (a) and Mt (b) coronal images of both kidneys in a normal pig, and the MTR map (c) at 600Hz offset frequency. (d) The normalized MTR map overlaid with the M0 image. Renal MTR was normalized by the MTR of the ipsilateral psoas muscle major to correct for B1 variations. (e) A representative T1/T2*-weighted image with TR/TE at 200/15.4ms shows good contrast between cortex and medulla. (f) Algorithm for semi-automatic selection of cortical and medullary regions of interest (ROIs). (g) Cortical and medullary ROIs overlaid with the T1/T2*-weighted image.

