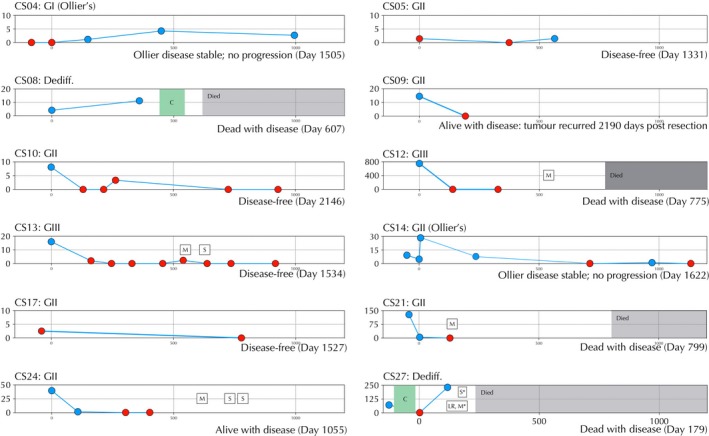
Figure 3.

Time course figures for patients with serial analysis of ctDNA. Patient ID and grade are shown in the top left of each figure. Disease status is shown at the bottom left of each figure. X‐axis: days since primary surgery. Y‐axis: mutant IDH1 copies/mL plasma. Red points indicate a negative result of 1 or no droplets, blue points indicate ctDNA positive time points. C, chemotherapy; S, surgery, M, metastasis, LR, local recurrence. CS01 and CS20 have been excluded from this figure as all time points were negative.
