
Figure 1.
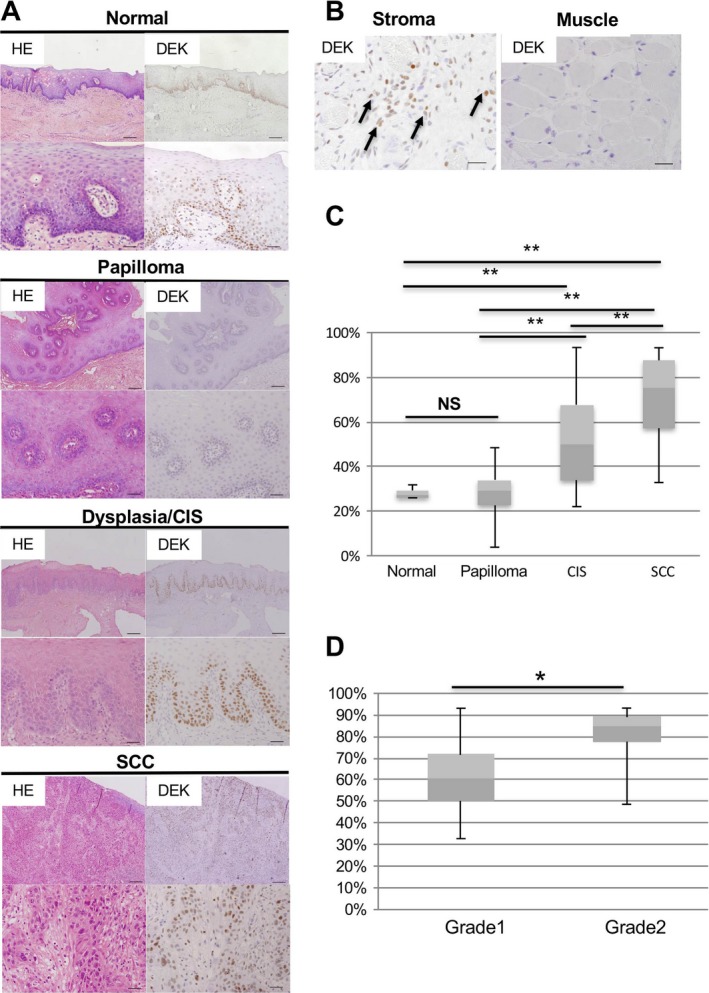
DEK overexpression in human OSCC. (A) Representative images of HE staining and IHC analysis of DEK expression in human oral tissues. Normal, normal mucosa adjacent to OSCC; CIS, carcinoma in situ; SCC, squamous cell carcinoma. Scale bars, 200 and 40 μm in the upper and lower images respectively. (B) DEK expression in the stroma and muscle layer. Arrows indicate DEK‐positive cells. Scale bars, 40 μm. (C) The positive index of DEK in normal mucosa, papilloma, CIS, and SCC in oral tissues. Boxes: 25th–75th percentiles; the median is the central line in each box (**P < 0.01; NS, not significant). (D) The positive index of DEK in grade 1 and grade 2 OSCC. Boxes: 25th–75th percentiles; the median is the central line in each box (*P < 0.05; NS, not significant).