
Figure 6.
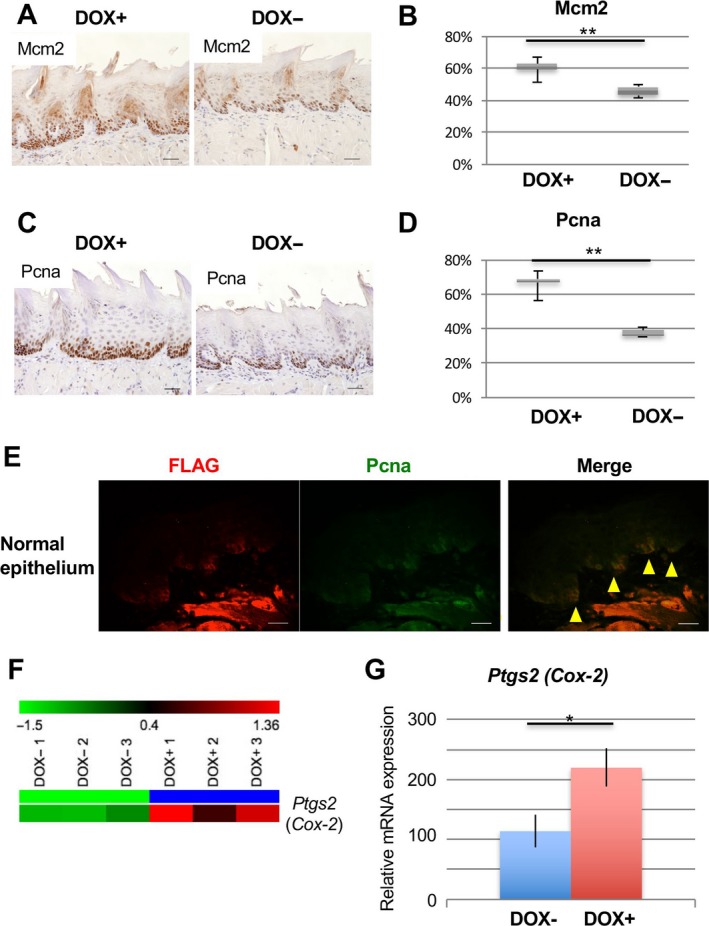
Induced DEK expression enhanced MCM2 and PCNA protein expression in normal‐appearing tongue epithelium exposed to 4NQO. (A) Representative images of IHC analysis for detection of MCM2 in tongue tissues from 4NQO‐treated mice with or without DOX treatment (DOX+ and DOX‐ respectively). Scale bars, 40 μm. (B) The positive index of MCM2 in normal tongue epithelium from mice. Data are means ± SDs. ** P < 0.01. (C) Representative images of IHC analysis for detection of PCNA in the tongues of 4NQO‐treated mice with or without DOX (DOX+ and DOX‐ respectively). Scale bars, 40 μm. (D) The positive index of PCNA in normal tongue epithelium from mice. Data are means ± SDs. ** P < 0.01. (E) Double immunofluorescent staining for FLAG (red) and PCNA (green) in normal tongue epithelium from DOX+ iDek mice. Yellow arrows indicate double‐positive epithelial cells. Scale bars, 20 μm. (F) Heat map representations of microarray analysis of Ptgs2 (Cox‐2) in DOX+ and DOX‐ iDek mice treated with 4NQO. These values were resized to the distance from the median for single genes (green, low expression to red, high expression). (G) RNA expression was measured by real‐time RT‐PCR for Ptgs2 (Cox‐2). Data are means ± SDs. * P < 0.05.