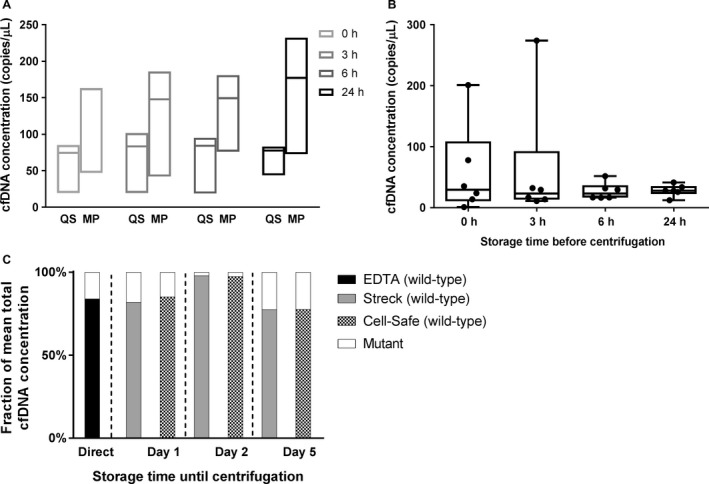
Figure 3.

Influence of storage time on cfDNA concentrations until centrifugation. Time points T 1–T 6 are depicted on the x‐axes. Median cfDNA concentrations were depicted on the y‐axes for average yields of pooled EDTA samples after analysis using assay 1 (A), and paired EDTA samples from six healthy individuals after using assay 2 (B). In six blood samples collected in Streck and CellSave BCTs using assay 6, 7, 10–12 (C). At each consecutive time point, mean mutant and wild‐type cfDNA concentrations from samples of two other individuals were compared with the mean cfDNA concentration of the matching EDTA samples, as depicted by mutant/wild‐type fractions (y‐axis). QS QIAsymphony, MP MagnaPure.
