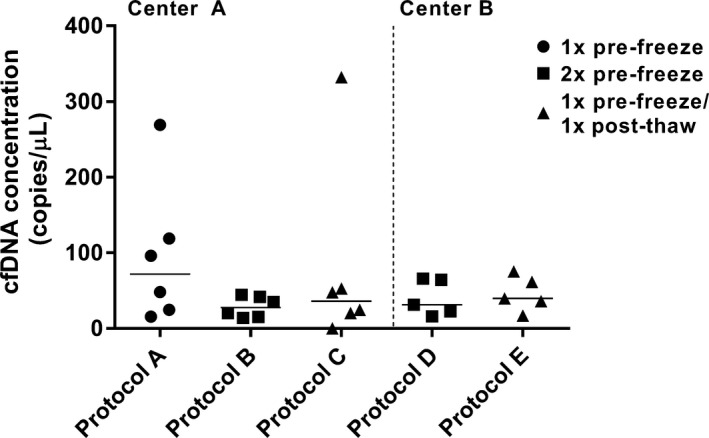
Figure 4.

Comparisons of centrifugation protocols A–C, and D and E. Comparisons were performed separately in centers A and B using assay 2 and 5, respectively. Absolute cfDNA concentrations (y‐axis) detected in individuals are depicted for each protocol.
