
Figure 5.
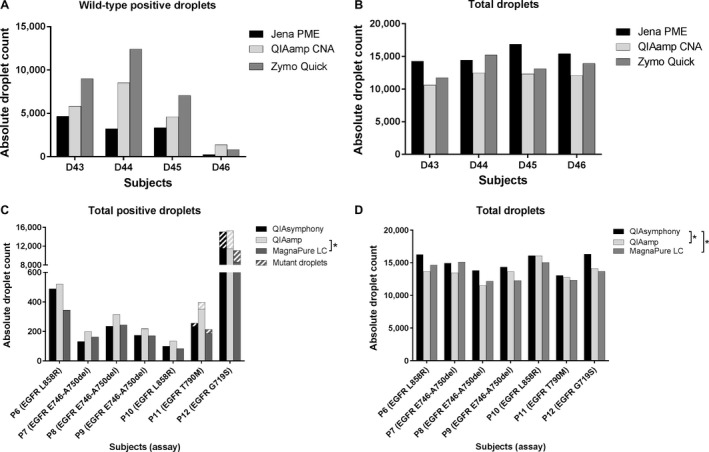
Isolation methods in healthy individuals and cancer patients. Absolute droplets counts are shown on the y‐axes. For healthy individuals, wild‐type (A) and total‐positive droplet (B) yield using assay one were depicted. For cancer patients, the sum of mutant and wild‐type positive droplets (C), as well as total droplet yields (D) where depicted using assay 6–9 (*P < 0.05).