
Figure 5.
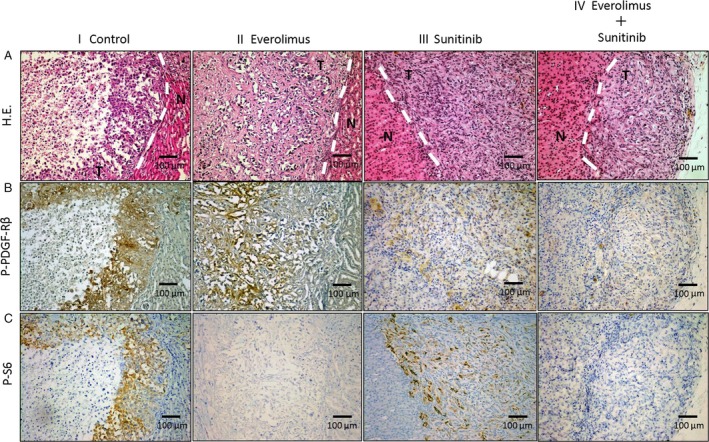
Immunohistochemistry for p‐PDGF‐Rβ, p‐S6, and Ki‐67. Mice with kidney Caki‐1 tumors were treated with (i) vehicle (control), (ii) everolimus, (iii) sunitinib, or (iv) everolimus + sunitinib. (A) Hematoxylin and eosin (H.E.) stain. (B) Phosphorylation of PDGF‐Rβ in tumor nests as measured by treatment with sunitinib or everolimus and sunitinib in combination. (C) Phosphorylation of S6 in tumor nests as measured by treatment with everolimus or everolimus and sunitinib in combination. Data are expressed as the mean ± SEM. *P < 0.01, **P < 0.05. Scale bars: 100 μm (A–C).