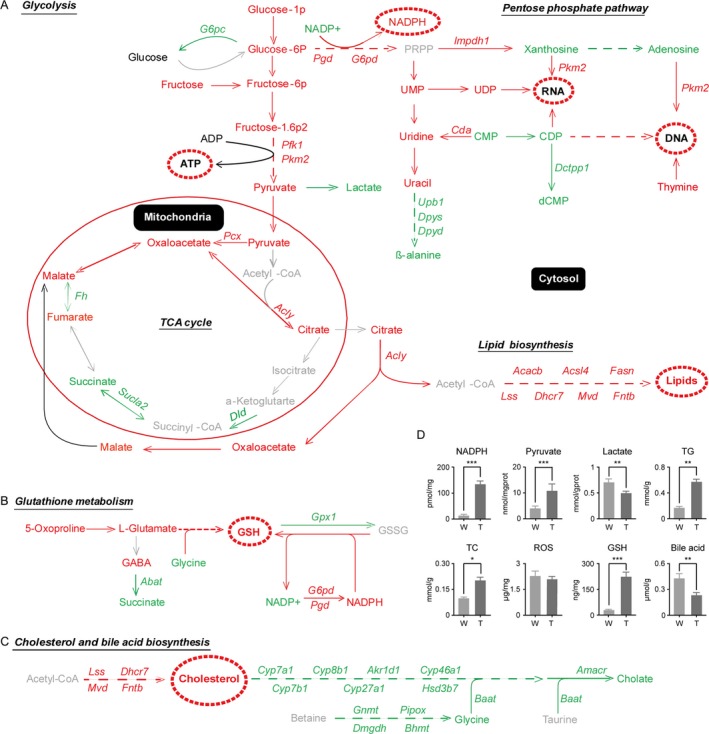
Figure 4.

Schematic representations of the most relevant metabolic and transcriptional differences between HCC and wild‐type liver tissues. Metabolic pathways related to glycolysis, the TCA cycle, PPP, and lipid biosynthesis. (B) Metabolic pathways related to glutathione. (C) Metabolic pathways related to cholesterol and bile acid synthesis. Red indicates significantly higher concentrations of metabolites, expression levels of enzymes, or enhanced pathways in HCC; green indicates significantly lower concentrations of metabolites, expression levels of enzymes, or attenuated pathways in HCC; and gray indicates unchanged or undetermined results. The standard letters indicate metabolites, the italic letters indicate enzymes, and the underlined italic letters indicate pathways. The metabolites with broken circles indicate the central metabolites in HCC. (D) The reduced form of nicotinamide adenine dinucleotide phosphate (NADPH), pyruvate, lactate, cholesterol (TC), triglyceride (TG), ROS, GSH, and bile acid (BA) was detected in wild‐type liver (W) and HCC (T) tissues using the methods described in the Materials and Methods section. The data are expressed as the mean ± SEM (n = 8). *P < 0.05, **P < 0.01, and ***P < 0.001.
