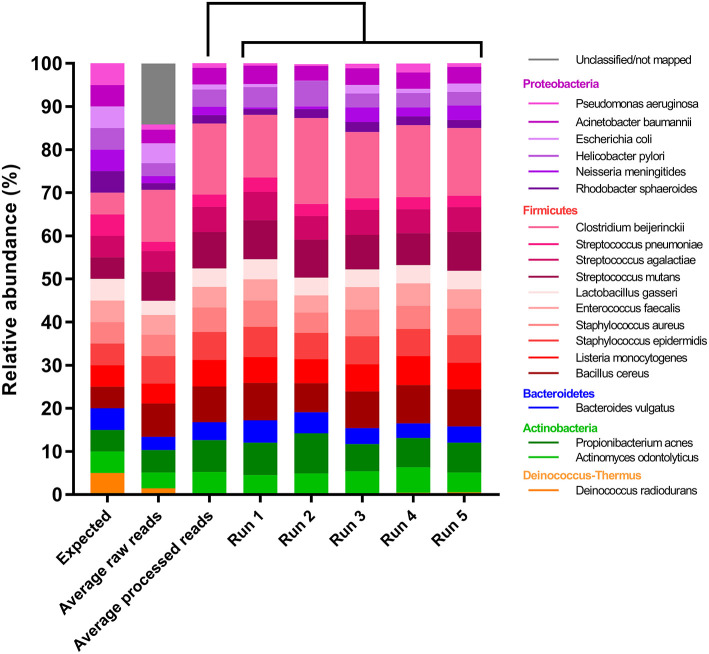
Figure 1.
Relative abundance estimates of the 20-member mock community compared with the expected. Columns from left to right: Expected relative abundances, average relative abundances using the raw reads, average relative abundances using the processed reads and relative abundances in each of the five sequencing runs.

