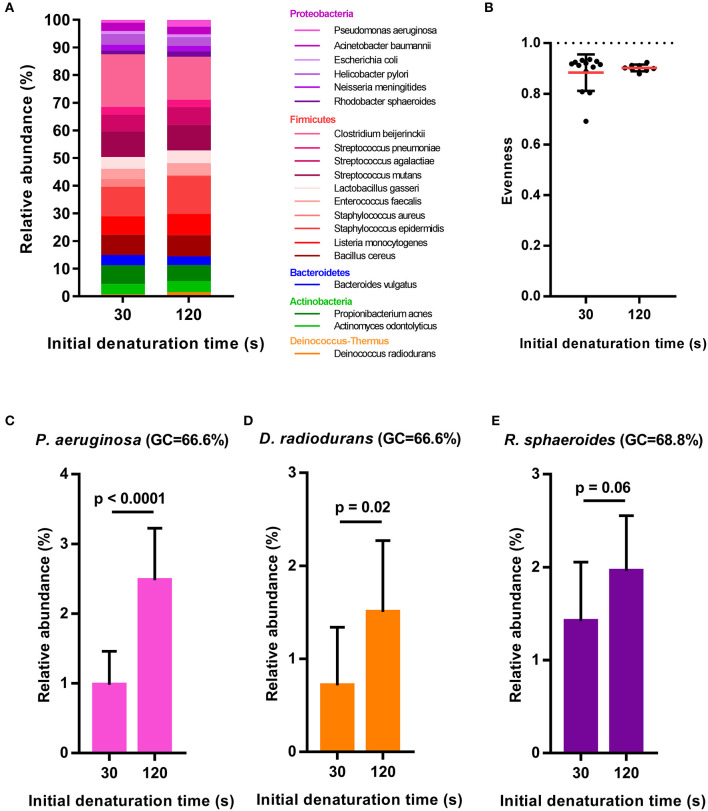
Figure 4.
Relative abundance estimates of the 20-member mock community following different initial denaturing times of 30 s (n = 13) or 120 s (n = 8) during the library preparation PCR. (A) Bar plots of mean relative abundances of all mock community members, (B) Evenness of the mock community with dashed line indicating the expected evenness of 1 and (C–E) Bar plots showing mean relative abundance + sd for the three mock community members with highest GC-content. Statistical significance is evaluated by t-test.

