Figure 4.
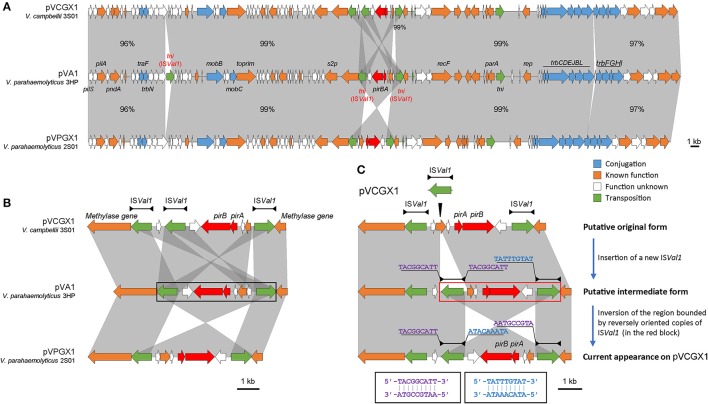
Analysis of pirABvp-bearing plasmids pVCGX1 and pVPGX1. (A) Comparison of plasmids pVCGX1 and pVPGX1 with pVA1. Percentages indicate the identities in nucleotide level between syntenic regions. Percentages are not given for 100% identical regions. (B) A zoom-in view of the genetic context of pirABvp. Horizontal lines shown above the schematics, with both ends demarcated by solid triangles to indicated IRs, represent the ISVal1. Black block denotes the 5.5-kb pirABvp fragment describe in the text. (C) Putative evolution process of the genetic context of pirABvp on plasmid pVCGX1. Thin triangle indicates IS insertion. In the red block is the putative region going inversion. Nucleotide sequences flanking the ISVal1 elements are shown in 5′ → 3′. Sequences in identical colors are reverse-complement to each other as denoted in the black blocks. Gene organization is drawn to scale. Red arrows indicate pirABvp genes. Genes with other known functions are denoted using different colors. Syntenic regions were highlighted in gray.

