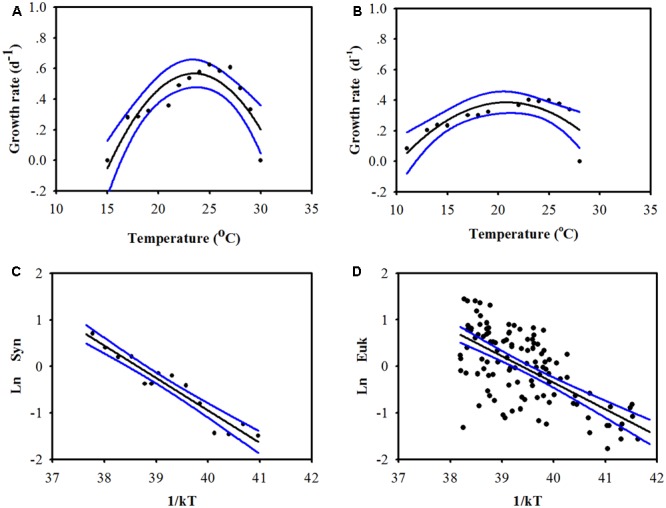
FIGURE 2.

Relationship between temperature and the growth rates of low-latitude-dominated Prochlorococcus (A, eMIT9312, using lab data, growth rate = –4.17 + 0.40 × temperature – 0.0086 × temperature2, r2 = 0.78, P < 0.001), high-latitude-dominated Prochlorococcus (B, eMED4, using lab data, growth rate = –1.11 + 0.14 × temperature – 0.0035 × temperature2, r2 = 0.60, P < 0.01), Synechococcus [C, using lab data, according to the Arrhenius equation, LnμSyn = –0.73 (CI = –0.88 to –0.60)/kT + 28.13 (CI = 23.20–34.15), r2 = 0.92, P < 0.001], and picoeukaryotes [D, using field data when Chl is higher than 0.5 mg m-3, according to the Arrhenius equation, LnμEuk = –0.86 (CI = –1.07 to –0.68)/kT + 33.85 (CI = 26.94–42.35), r2 = 0.41, P < 0.001]. The blue lines and the value in the parentheses represent the 95% confidence interval (CI). The growth rate data of Prochlorococcus, Synechococcus, and picoeukaryotes were collected from Johnson et al. (2006), Chen et al. (2014), and Pittera et al. (2014), respectively.
