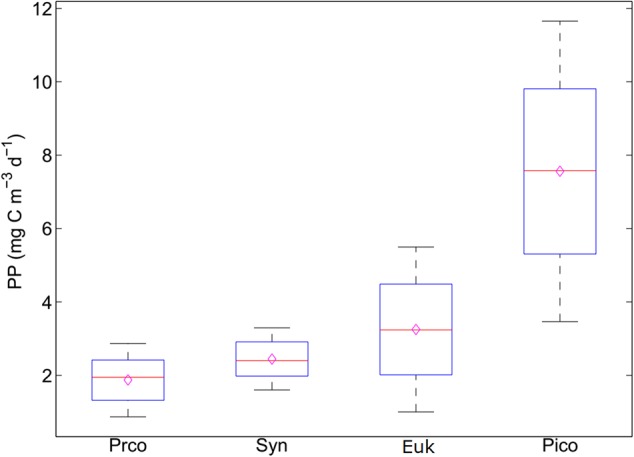
FIGURE 3.

Sensitivity analysis of the carbon conversion factors on the primary production of picophytoplankton. The black lines represent the 95% confidence interval. The red line represents the median value. The hollow purple diamond represents the mean value. Proc, Prochlorococcus; Syn, Synechococcus; Euk, picoeukaryotes; Pico, picophytoplankton.
