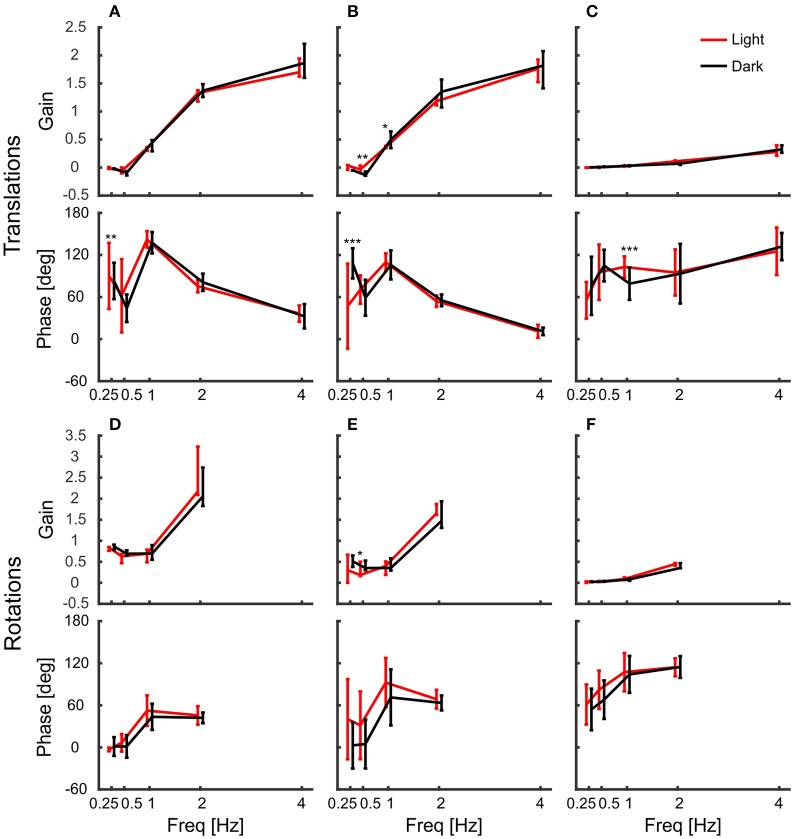
Figure 6.
The body compensated low frequency/large amplitude x and y rotations. (A–F) Median gains and phases of the body in response to platform translations along the x-axis (A), the y-axis (B), and the z-axis (C), and respective platform rotations around x (D), y (E), and z (F) are shown for light (red) and dark (black) conditions against frequency. All error bars show 25 and 75 percentiles of the median gains and standard deviation of the mean phase of 10 animals. Asterisks indicate significant differences between light and dark conditions (U-Test, Watson-Willliams test, *p < 0.05; **p < 0.01; ***p < 0.001).

