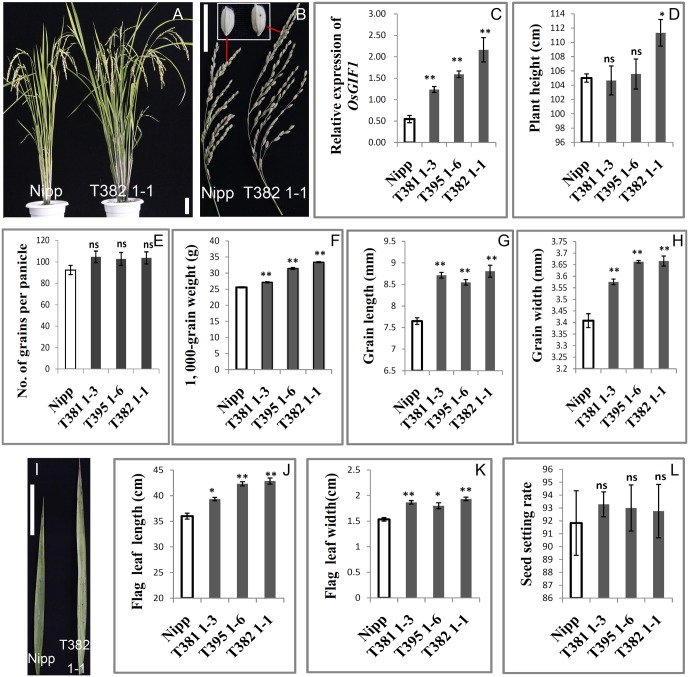
FIGURE 3.
Increase in the size of multiple rice organs caused by overexpression of OsGIF1. Comparisons of several important traits between the OsGIF1 overexpression and control plants. (A) Plant phenotype; (B) panicle and grain; (C) relative expression level of OsGIF1; (D) plant height; (E) number of grains per panicle; (F) 1000-grain weight; (G) grain length; (H) grain width; (I) leaf; (J) flag leaf length; (K) flag leaf width; and (L) seed setting rate. Scale bars: 10 cm. Values are all shown as mean ± SEM (n = 3). Asterisks indicate significant differences between the WT and overexpression plants as determined by Student’s t-test: ns, not significant; ∗∗p ≤ 0.01; ∗p ≤ 0.05.

