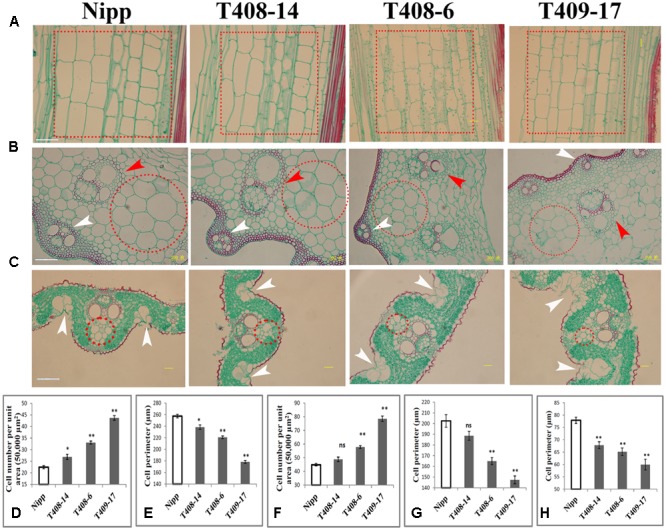
FIGURE 4.

OsGIF1 regulation of cell size to control rice organ size. (A–C) Paraffin section analysis of the stems and leaves of KO plants. (A) Longitudinal section of stem internode; dotted boxes in red indicate the major cell types selected for cell counting and measuring. (B) Cross section of stem internode. Red arrow heads indicate inner vascular bundles, and white arrow heads indicate outer vascular bundles. Dotted circles in red indicate the major cell types selected for cell counting and measuring. (C) Cross section of leaves. White arrow heads indicate bulliform cells. Dotted circles in red indicate the major cell types selected for cell counting and measurement. The first internode from the bottom and the middle region of the flag leaf of all plants were collected for observation. Scale bars (50 μm) are shown in Nipp. (D–H) Cell number and size determinations. (D) Cell number per unit area in A; (E), cell size in A; (F), cell number per unit area in B; (G), cell size in B; (H), cell size in C. For cell numbers (per unit area) counting, a total area of 50,000 μm2 for each sample was investigated. For cell volume determination, 10 representative cells within the dotted circles/boxes regions were selected for cell size measuring. Values are all shown as mean ± SEM (n = 3). Asterisks indicate significant differences between the WT and KO plants as determined by Student’s t-test: ns, not significant; ∗∗p ≤ 0.01; ∗p ≤ 0.05.
