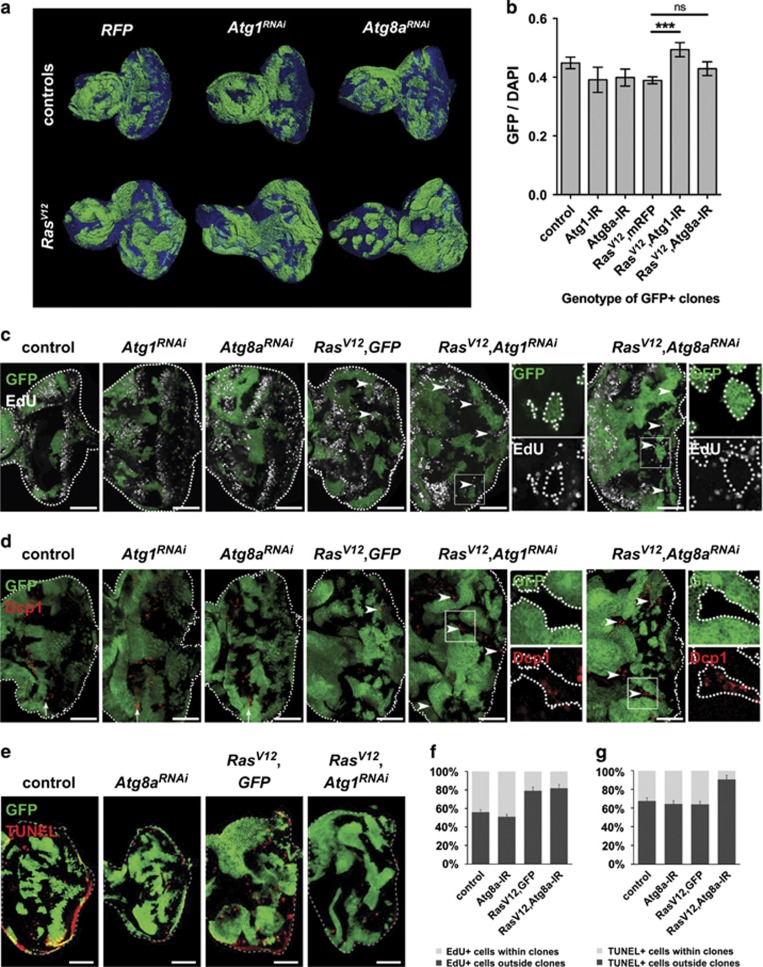
Figure 5.
Autophagy inhibition in Ras-activated tissues results in cell- and non-cell-autonomous effects on tissue growth. (a) Three-dimensional (3D) reconstruction of RasV12AtgRNAi and control eye-antennal mosaic discs from L3 wandering larvae. Mutant clones are GFP+ and tissues were counterstained with DAPI (blue). (b) In discs expressing both RasV12 and Atg1RNAi in clones, the proportion of GFP tissue was significantly higher than in the control RasV12 mRFP samples (49.4±2.4%, compared to 38.9±1.2%, P=0.00028). This trend was also observed in RasV12 Atg8aRNAi, although the difference was not significantly different (42.9±2.3%, P=0.068). (c) Non-cell-autonomous proliferation in wild-type tissue (non-GFP) surrounding RasV12GFP, RasV12 Atg1RNAi or RasV12Atg8aRNAi clones (GFP+), as seen by EdU incorporation. (d) Non-cell-autonomous caspase activation in wild-type tissue (non-GFP) surrounding RasV12Atg1RNAi or RasV12Atg8aRNAi clones (GFP+), as seen by Dcp1 staining. Arrows indicate the apoptotic wave before the MF. (e) Apoptosis is confirmed by TUNEL assay around clones expressing RasV12 and Atg8a-RNAi. (f') Quantification of data in (d). (g) Quantification of data in (e). Error bars=s.e.m. Statistics: one-way ANOVA with Tukey's multiple correction test. Scale bars: 50 μm.

