Figure 6.
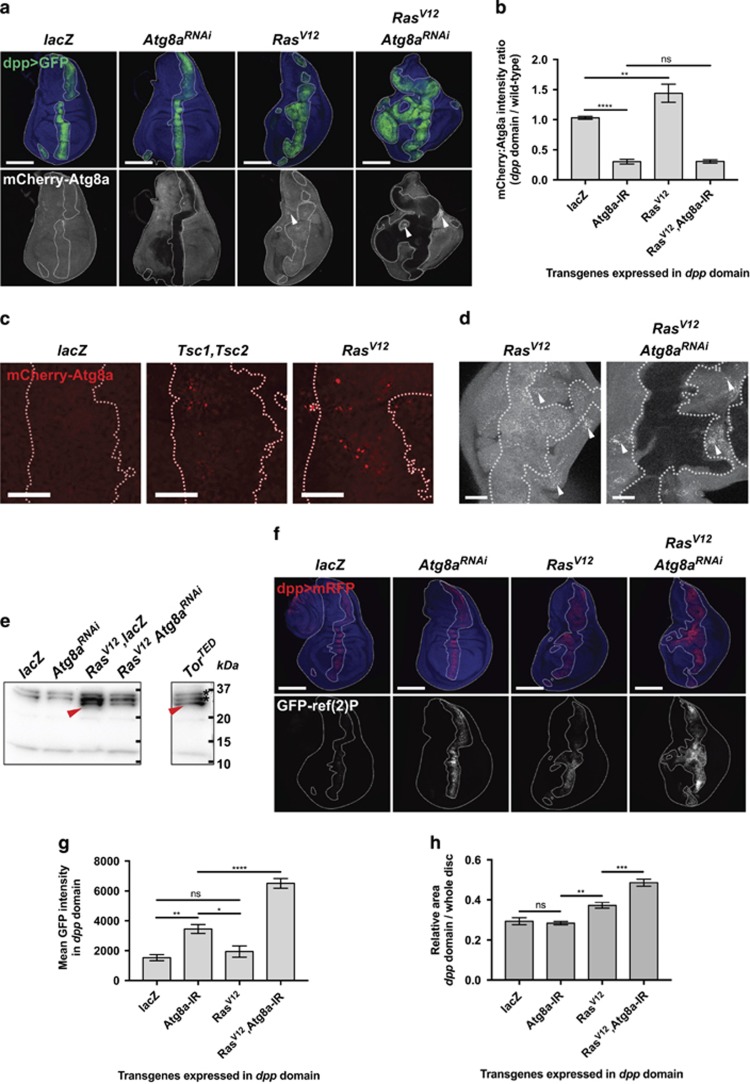
RasV12 expression induces autophagy. (a–d) Effect of Atg8aRNAi, RasV12 and RasV12 Atg8aRNAi expressed via the dpp-GAL4 driver on pmCherry-Atg8a expression in L3 wing discs. mCherry-Atg8a levels (b) are increased upon Ras activation. (c) mCherry-Atg8a punctae are detected in the Dpp domain (dotted lines) upon expression of Tsc1 and Tsc2 transgenes (positive control) or RasV12, while no puncta is detected upon expression of a control lacZ. (d) Non-cell-autonomous activation of autophagy is also observed in wild-type tissue surrounding RasV12 and RasV12 Atg8aRNAi tissue (arrowheads). (e) Monitoring of autophagy flux induction by detection of free mCherry in mCherry-Atg8a tissues. A 27 kDa band corresponding to free mCherry is detected in wing discs expressing RasV12 and RasV12 Atg8aRNAi in the Dpp domain, as well as in the positive control expressing TorTED. *, unspecified band. (f) Effect of Atg8aRNAi, RasV12 and RasV12 Atg8aRNAi expressed via the dpp-GAL4 driver on GFP-Ref(2)P accumulation in L3 wing discs. Atg8a knockdown in the Dpp domain blocks autophagic flux as seen by accumulation of GFP-Ref(2)P aggregates. Slight accumulation of Ref(2)P aggregates is detected upon Ras activation, and blocking autophagic flux in this context leads to massive accumulation of Ref(2)P aggregates in the Dpp domain, quantified in (g). (h) As in the developing eye epithelium, autophagy inhibition in a Ras-activated background leads to tissue overgrowth, with proportion of GFP+ tissue higher in RasV12 Atga-RNAi compared with Ras-only or Atg8a-RNAi-only controls. Scale bars: (a and e) 100 μm, (c) 20 μm and (d) 50 μm. Error bars: s.e.m. Statistics: one-way ANOVA with Tukey's multiple correction.

