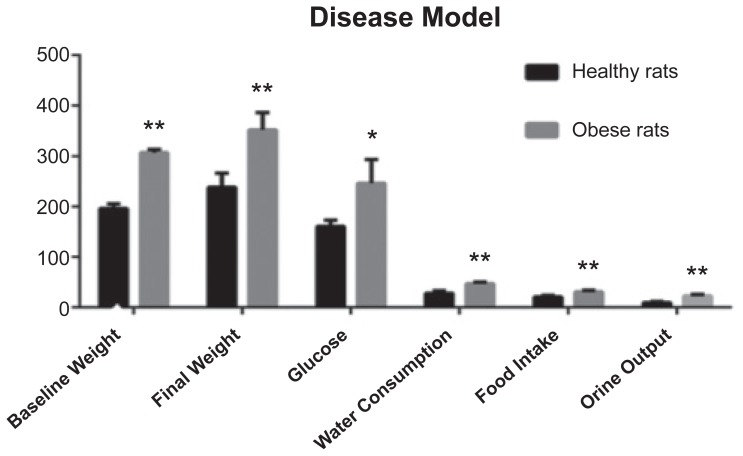
Figure 1.
Differences are seen between the clinical data that allow us to define the presence of obesity and DM2. The values are expressed as means + SDs. Baseline and final weight are in g, serum glucose level in g/dL, water consumption in mL, food intake in g, and orine output counting in mL, all of which are means per day. * = P ≤ 0.05, and ** = P ≤ 0.01.
DM2, Type 2 diabetes mellitus; SDs, standard deviations.

