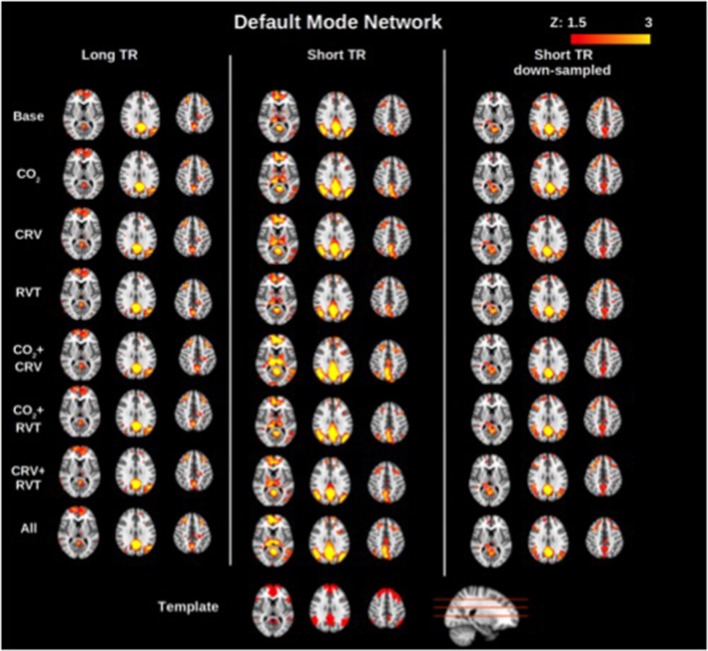
Figure 3.
Group-averaged default mode network (DMN) connectivity maps generated with different physiological correction strategies, using long-TR, short-TR, and down-sampled short-TR data. A default mode network template from the atlas generated by Yeo et al. (2011) is shown at the bottom for reference. Physiological correction does not noticeably alter connectivity maps. As in the motor network case, connectivity maps generated from data with different sampling rates are comparable.

