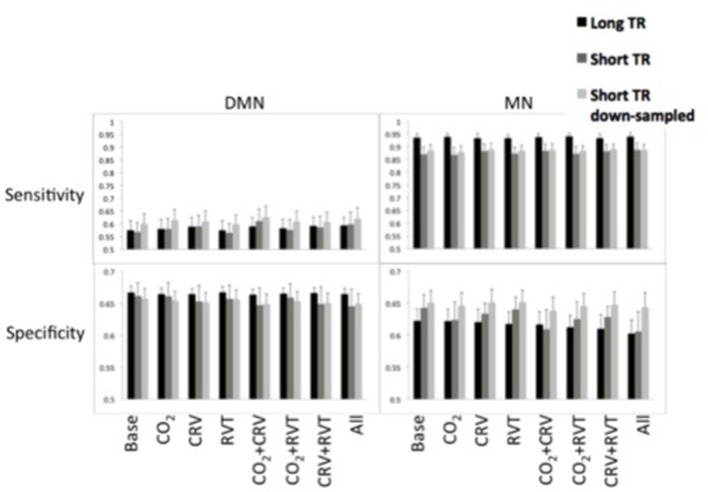
Figure 7.
Sensitivity (top) and specificity (bottom) measures of the default-mode network (DMN) (left) and motor network (MN) (right) for different physiological correction strategies, based on long-TR (black), short-TR (dark gray), and down-sampled short-TR (light gray) data. DMN demonstrated lower sensitivity and higher specificity compared to MN. CRV correction increased sensitivity and decrease specificity of DMN connectivity maps. Physiological correction did not considerably alter the sensitivity of MN connectivity maps and tended to reduce their specificity. For the MN, long-TR data was associated with higher sensitivity and lower specificity.

