
FIGURE 1.
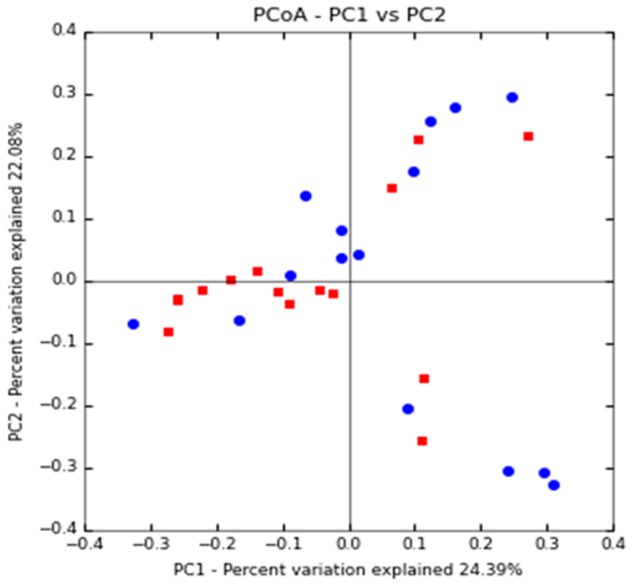
Clustering of fecal bacterial communities according to the different study groups by principal coordinate analysis (PCoA) using unweighted UniFrac distances. Each point corresponds to a community coded according to the patient group. The percentage of variation explained by the plotted principal coordinates is indicated on the axes. CAD-DM2 (red dots) and CAD-NDM2 (blue dots).