
FIGURE 2.
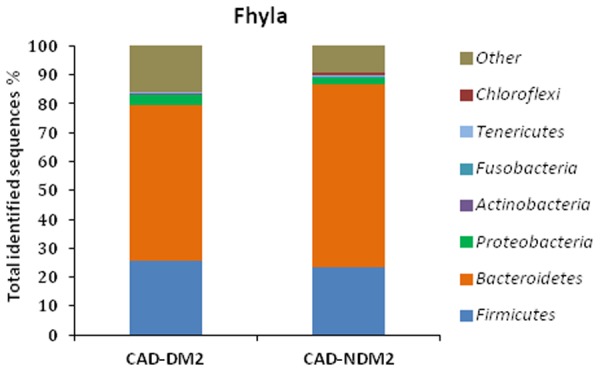
Pyrosequencing analysis of phyla in CAD-DM2 and CAD-NDM2 groups. Data are shown as a percentage of the total identified sequences per group.
Official websites use .gov
A
.gov website belongs to an official
government organization in the United States.
Secure .gov websites use HTTPS
A lock (
) or https:// means you've safely
connected to the .gov website. Share sensitive
information only on official, secure websites.
Pyrosequencing analysis of phyla in CAD-DM2 and CAD-NDM2 groups. Data are shown as a percentage of the total identified sequences per group.