
FIGURE 5.
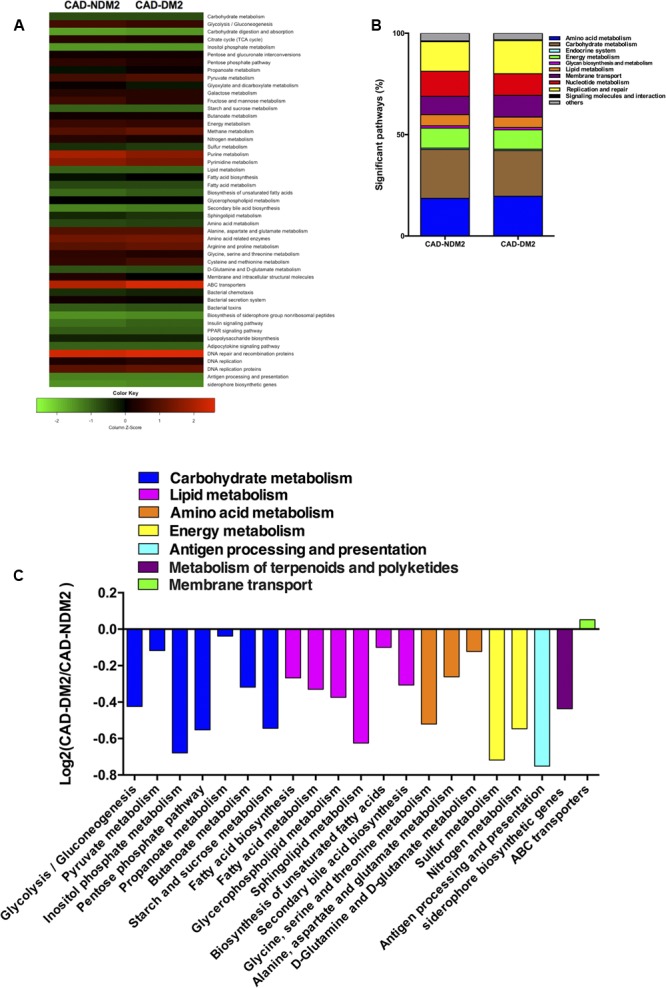
Predicted functional composition of metagenomes based on 16S rRNA gene sequencing data of CAD-DM2 and CAD-NDM2 groups. (A) Heatmap of differentially abundant KEGG pathways identified in both study groups. The values of color in the heatmap represent the normalized relative abundance of KEGG pathways. (B) Relative abundances of significant predicted functions of each study group. (C) Log2-fold change of the abundances of KEGG categories showing significant difference between CAD-DM2 and CAD-NDM2 groups.