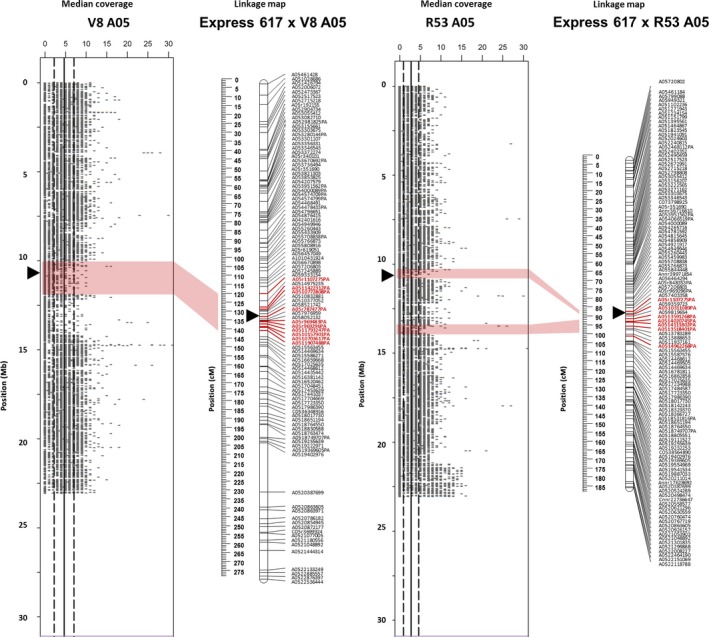
Figure 2.

A05 Deletion in the synthetic B. napus genotypes V8 und R53 identified by resequencing and validated by genetic mapping. The plots show resequencing read coverage across the lengths of the respective chromosomes, calculated for segments of 1 kb. The genetic linkage maps on the right of the read plots show genetic mapping including SNPs with normally segregating, bi‐allelic calls with locus names in black text. SNPs called as deletions (presence–absence markers, with suffix ‘–PA’) are indicated by bold red marker names, whereas SNPs with heterozygous–homozygous segregation due to polymorphism in one of two duplicated copies (with suffix ‘–het’) are indicated by bold blue marker names. Polymorphic markers in bold magenta text indicate duplicated markers mapping to their homoeologous position. Opaque red blocks link putative deletions detected in coverage blocks with the corresponding regions in the genetic maps. Centromere regions are indicated by black triangles according to (Mason et al., 2013).
