
Figure 4.
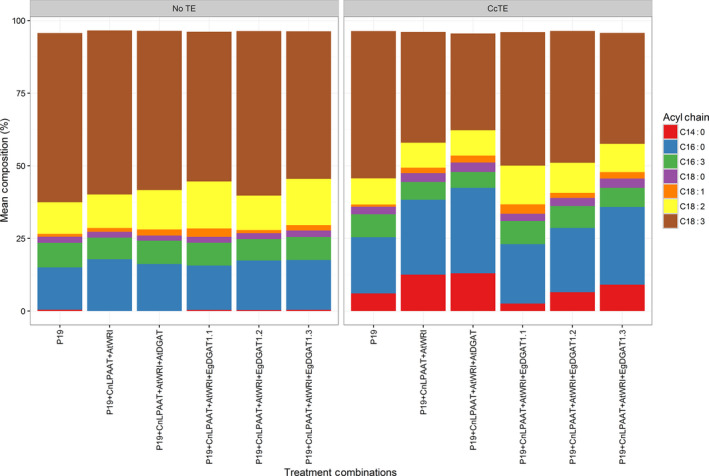
Investigating the effects of DGAT1 co‐expression on fatty acid profile changes in the membrane lipids (phospholipids) (n = 3). Results in the figure represent each fatty acid as a percentage of total fatty acid methyl esters (FAME) of the phospholipid fraction only. ‘CcTE’ represents the expression of the thioesterase from Cinnamomum camphora. CnLPAAT = Cocos nucifera lysophosphatidic acid acyltransferase; AtWRI = Arabidopsis thaliana WRINKLED1; AtDGAT = A. thaliana diacylglycerol acyltransferase 1; EgDGAT = Elaeis guineensis diacylglycerol acyltransferase.