Figure 1.
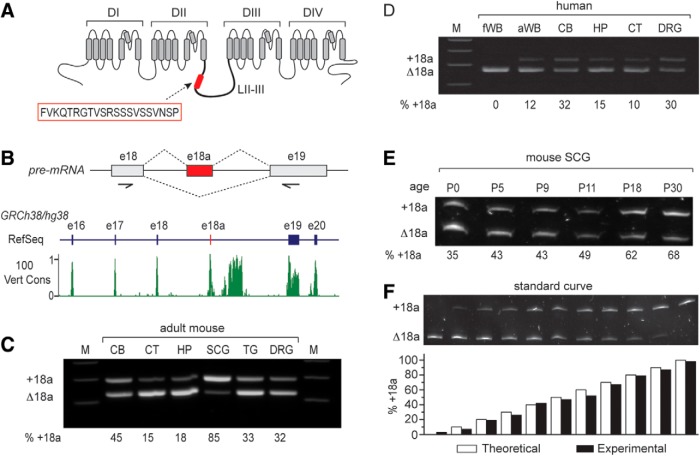
E18a expression in mouse and human tissue. A, Transmembrane spanning and pore regions of a voltage-gated calcium (CaV) channel α1 subunit. Highlighted are the four major domains (DI-DIV) and approximate location of the 21-amino acid peptide (red box) in the intracellular loop II-III (LII-III) encoded by e18a of Cacna1b. B, upper panel, Schematic of CaV2.2 pre-mRNA showing the e18a region and the two splice options (+18a or Δ18a). Arrows indicate the approximate location of PCR primers used to amplify human and mouse cDNAs. Lower panel, Visualization of RefSeq Genes and 100 vertebrates Basewise Conservation by PhastCons tracks using UCSC Genome Browser for human CACNA1B chr9:138 005,835-138 026,803 of Human December 2013 (GRCh38/hg38) assembly (https://genome.ucsc.edu/index.html; Kent et al., 2002). The region shown contains exons e16, e17, e18, e18a, e19, and e20 of human CACNA1B. In the RefSeq track, exons are denoted by vertical bars and introns by horizontal lines. E18a is not yet annotated in human genome assemblies, but we show its location by a red vertical bar. The conservation track displays the PhastCon scores from 0-1 after applying two-pixel smoothing. Regions of high conservation across vertebrates correspond to exons, including e18a. There is also a region of high conservation in the intron downstream of e18a. C, D, RT-PCR-amplified cDNA products separated in 3% agarose gels show e18a inclusion and exclusion in mRNAs of different tissue (upper band e18a, lower band Δ18a). Primers were located in constitutive e18 and e19, flanking e18a; product sizes were 291 bp (e18a) and 228 bp (Δ18a). C, Adult mouse cortex (CT) and hippocampus (HP) show the lowest levels of e18a inclusion, adult SCG the highest, and adult CB, trigeminal ganglia (TG), and DRG have intermediate levels of e18a inclusion. D, Human fetal whole brain (fWB) lacked detectable e18a, adult human whole brain (aWB), CT, and HP had low levels of e18a; and ∼30% of product amplified from adult human cerebellum (CB) and DRG contained e18a. E, RT-PCR amplified cDNA products from mouse SCG RNA, separated in 8% denaturing polyacrylamide gel. E18a inclusion increases with development from P0 (35%) to P30 (68%). F, Calibration curve validates quantification of relative amounts of e18a and Δ18a by RT-PCR. PCR products were separated in denaturing 8% polyacrylamide. Bar graph shows % e18a-CaV2.2 cDNA clone in the mix (white), and % e18a measured from densitometry analysis (black). Theoretical and experimental values are similar.

