Figure 7.

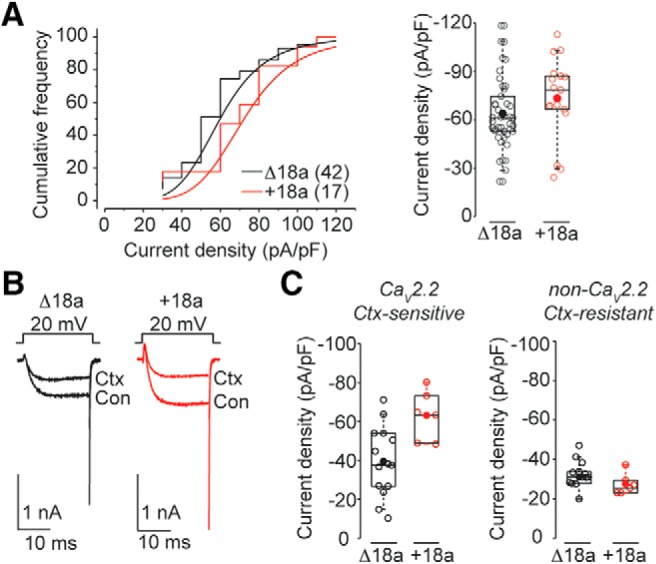
CaV2.2 currents in +18a neurons are larger compared to Δ18a-only neurons. A, left, Cumulative frequency plots of peak CaV current density recorded at 20 mV in SCG neurons from Δ18a-only and +18a-only mice. Right, peak CaV current density at 20 mV (pA/pF). Mean (median) values ± SE were for Δ18a-only: 61.54 (60.1) ± 3.24; +18a-only: 73.3 (78.5) ± 6.94 (Mann-Whitney rank sum test p = 0.035ih). B, left, CaV currents evoked by voltage steps to +20 mV from -80 mV in the absence (Con) and presence of 2 μM ω-conotoxin GVIA (Ctx) in acutely dissociated SCG neurons. C, CaV2.2 (Ctx-sensitive; left) and non-CaV2.2 (Ctx-resistant; right) currents in SCG neurons from Δ18a-only (black) and +18a-only (red) mice. Values for CaV2.2 current density mean (median) ± SE for Δ18a-only: -39.43 (-37.8) ± 4.8 pA/pF; +18a-only: 63.1 (-64.0) ± 5.2 (Student’s t test, unpaired p = 0.009i). Right, Values for non-CaV2.2 current density mean (median) ± SE for Δ18a-only: -31.1 (-31.0) ± 2.3 pA/pF; e18a-only: -27.5 (-26.2) ± 2.2 (Student’s t test, unpaired p = 0.353i). Experimenter was blind to genotype until after all recordings and analyses were complete. All box plots: values shown are for individual cells (open symbols), mean (filled symbol), median (horizontal line), 25th-75th interquartile range (box), and whiskers (range).
