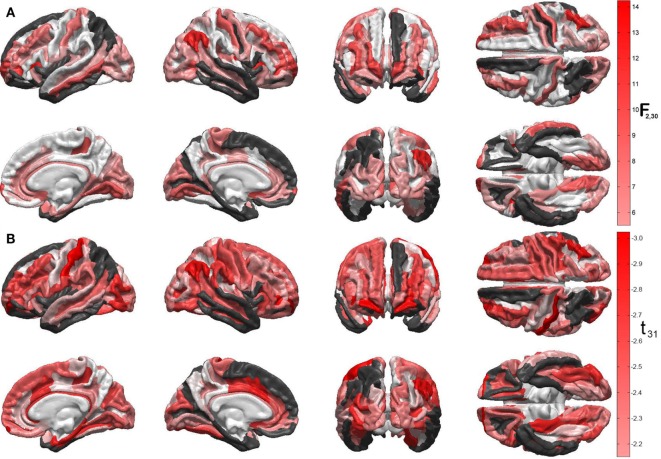
Figure 1.
(A) Quantification of the linear model’s ability to predict cortical atrophy extent at 6 months after injury. For each gyrus and sulcus, the null hypothesis that there is no statistically significant correlation between the predictor variables and the response variable (cortical thinning, in millimeters) was tested. Values of the F2,30 statistic for each statistical test are encoded on the cortical surface, subject to the false discovery rate correction for multiple comparisons. Darker red hues indicate higher significance of the statistical test and, consequently, stronger ability to predict cortical thinning for the areas in question. Regions where the null hypothesis was not tested because less than 90% of cortical thickness data were available (see text) are drawn in black. Regions where the test statistic was lower than the threshold F statistic of the reliability analysis permutation test are drawn in white. (B) Statistical significance of the correlation between relative cortical atrophy and the GOS-E. Values of the t31 statistic for each statistical test are encoded on the cortical surface, as in panel (A). Note that all values of this statistic are negative, which confirms that greater regional atrophy is associated with lower GOS-E values (i.e., poorer functional outcome), as expected. The values of F and t statistics in (A) and (B), respectively, are associated with different statistical tests and different degrees of freedom and, therefore, they should not be compared to one another.

