
Figure 3.
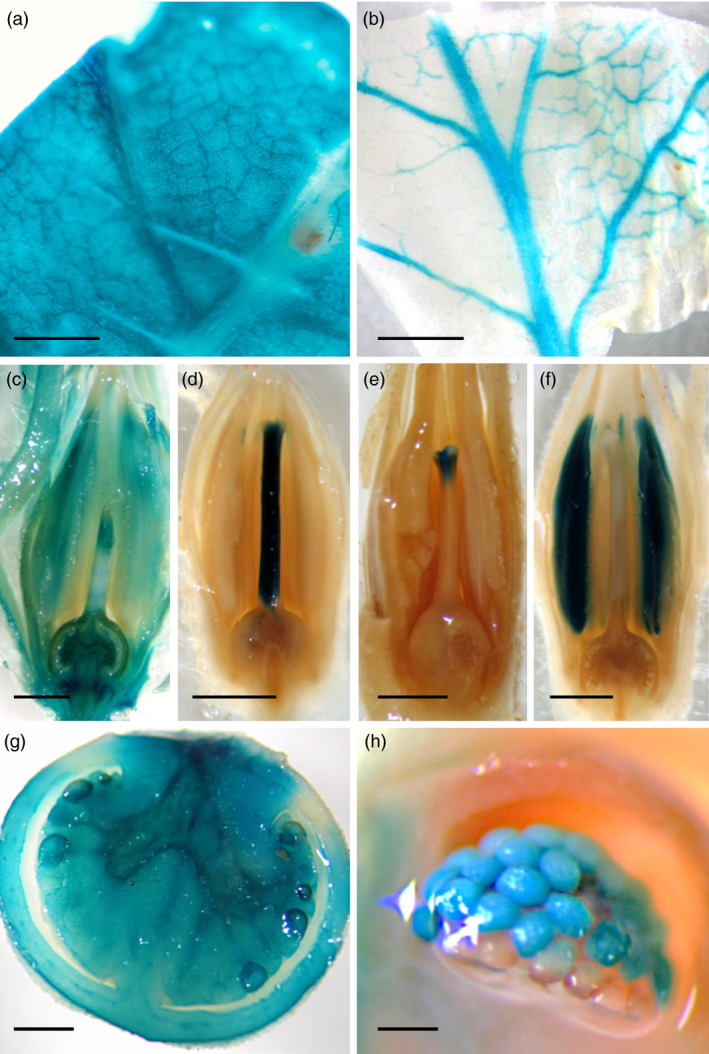
GUS expression patterns in enhancer trap lines. (a), (c) and (g) show organ‐specific GUS staining in leaf, flower and fruit, respectively. Tissue‐specific GUS expression was detected in vascular bundles of leaves (b), and in style (d), stigma (e), stamens (f) and ovules (h) of flowers. Scale bar = 1 cm in (a), (b) and (g); 0.25 cm from (c) to (f); and 50 μm in (h).