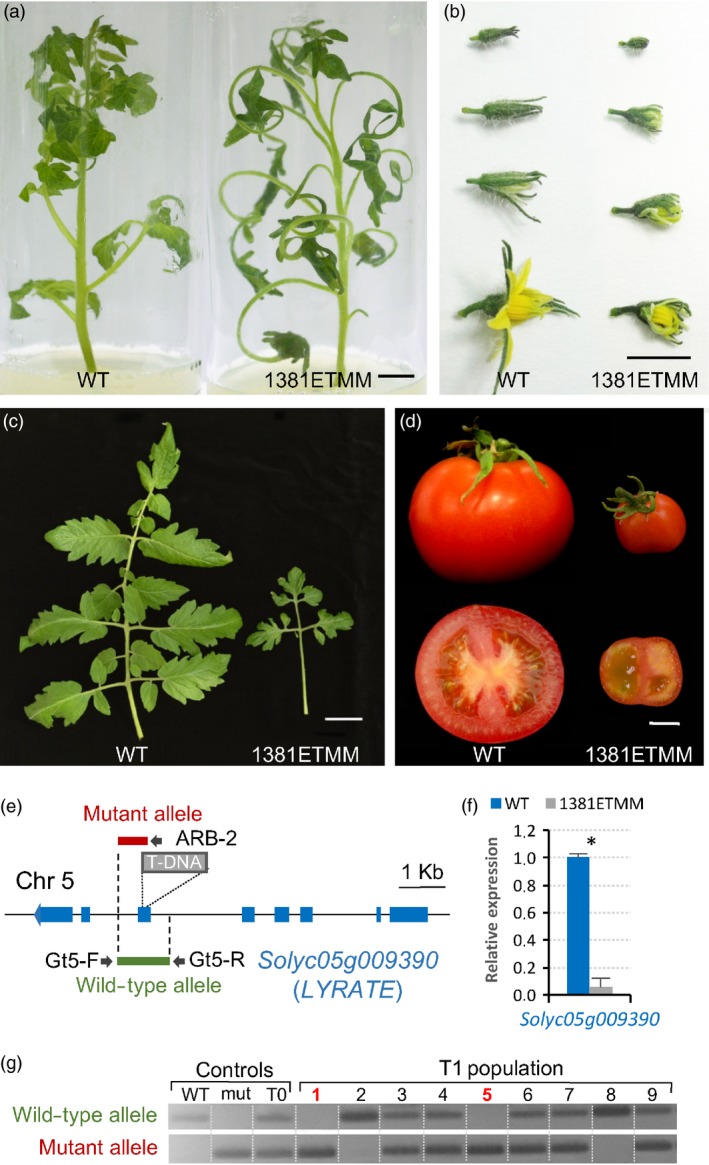
Figure 5.

Phenotypic and molecular characterization of the 1381ETMM line. Mutant plants of the 1381ETMM line were affected in the development of leaves (a, c), flowers (b) and fruits (d). (e) Schematic representation of T‐DNA localization in the 1381ETMM line. (f) Relative expression of LYRATE (Solyc05g009390) in wild‐type and 1381ETMM mutant plants. Asterisk denotes significant differences at P < 0.05. (g) Cosegregation analysis of T‐DNA insertion and 1381ETMM mutant phenotype. Red numbers indicate plants displaying mutant phenotype. Scale bar = 1 cm in (a), (b) and (d); and 5 cm in (c).
