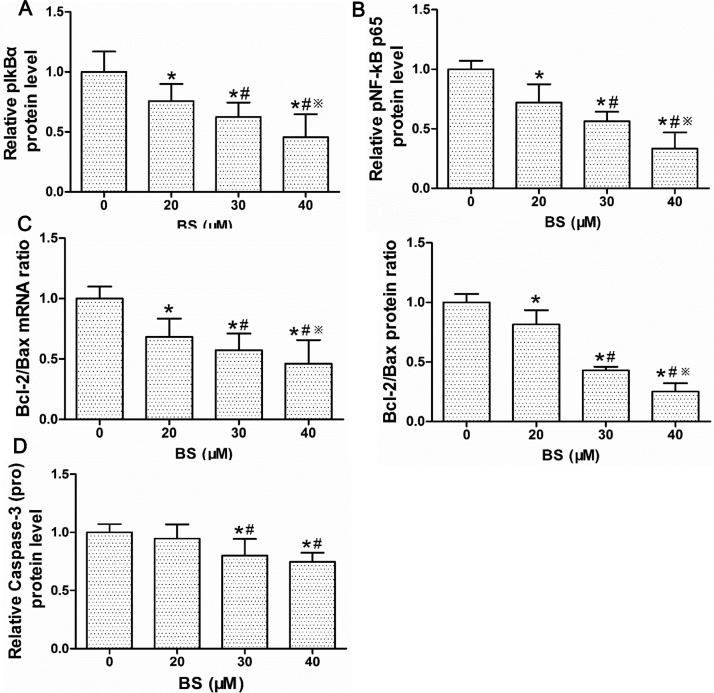
Fig. S4.
Statistical analysis of NF-κB pathway and key molecules in mitochondria-dependent apoptosis. Protein expression of (A) pIκB-α and (B) pNF-κB p65. (C) The gene and protein level of Bcl-2/Bax. (D) Protein levels of pro-caspase-3. Data were shown as mean ± std, n ≥ 3 and analyzed with One-way ANOVA. * p < 0.05 compared with control group. #p < 0.05 compared with 20 μM BS group. ※P<0.05 compared with 30 μM BS group.

