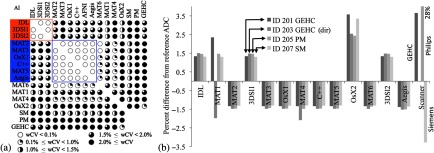
Fig. 3.
In vivo four -value ROI analysis results. (a) Pairwise wCV matrix for all implementations, shown graphically from (white circles) to (fully black circles), with groups A and B indicated. (b) Percent difference from the consensus values for each of four datasets, for each implementation and online map. Mean difference in ADC between groups A and B was 2.8%. The 28% deviation on the PM online ADC was due to a DICOM header corruption problem.

