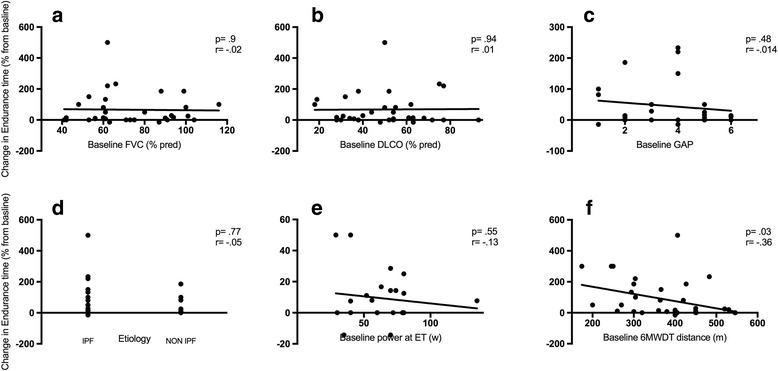
Fig. 5.

Correlation between baseline FVC (panel a), DLCO (panel b), GAP index (panel c), ILD etiology (panel d), power developed at endurance test (ET) (panel e), distance covered at 6MWDT panel f) and change in Endurance Time after PR. Statistical significant is indicated by p value while correlation is indicated by the Pearson’s correlation coefficient r
