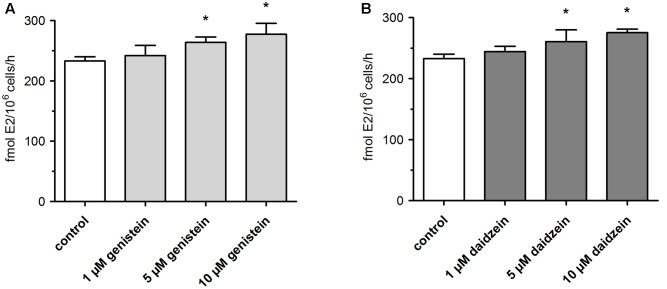
FIGURE 5.
Formation of active E2 by MCF-7 breast cancer cells. Cells were incubated with 100 nM E1 in the presence of (A) genistein or (B) daidzein. All data represent the means ± SD of four independent biological replicates. Asterisks (∗) indicate significantly different mean values in comparison to the controls (P < 0.05).

