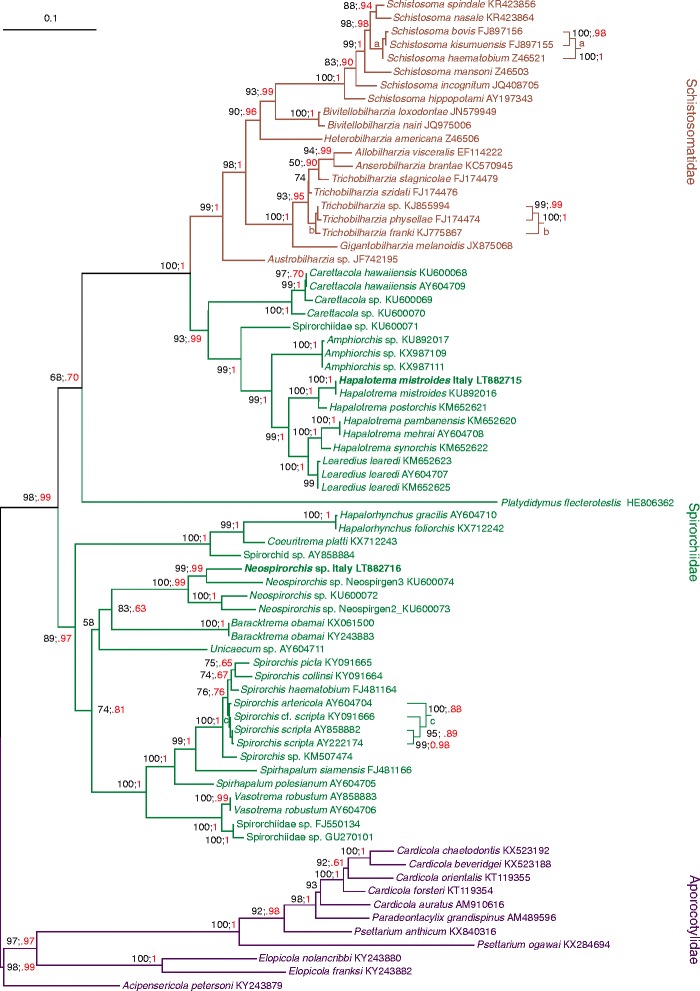
Fig. 4.

Phylogenetic analysis of spirorchiid flukes based on 28S sequences. The ML tree (-ln = 10,754.3072) was computed with IQ-TREE program. The scale-bar represents 0.1 substitutions/state change per position. Numbers in black represent ultrafast bootstrap values (> 50%) expressed in percent; numbers in red refer to Bayesian Inference posterior probabilities presented in a compressed way (e.g. 1 instead of 1.00; .95 instead of 0.95) to allow a better readability of the figure
