Fig. 1.

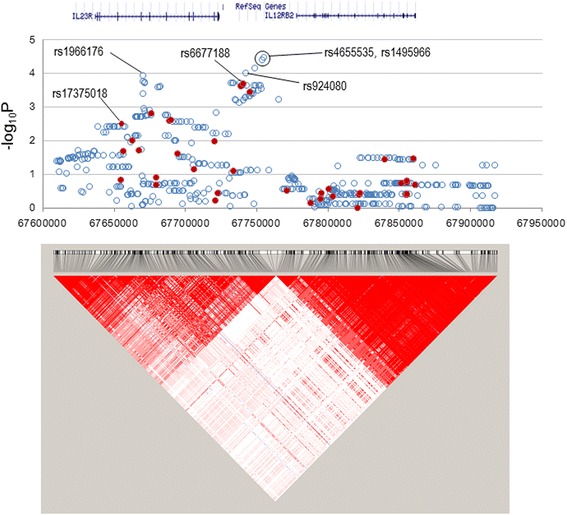
Manhattan plot for the IL23R–IL12RB2 locus. All imputed (solid red circles) and genome-wide association study (GWAS)-genotyped (open blue circles) SNPs are plotted together with a linkage disequilibrium structure below

Manhattan plot for the IL23R–IL12RB2 locus. All imputed (solid red circles) and genome-wide association study (GWAS)-genotyped (open blue circles) SNPs are plotted together with a linkage disequilibrium structure below