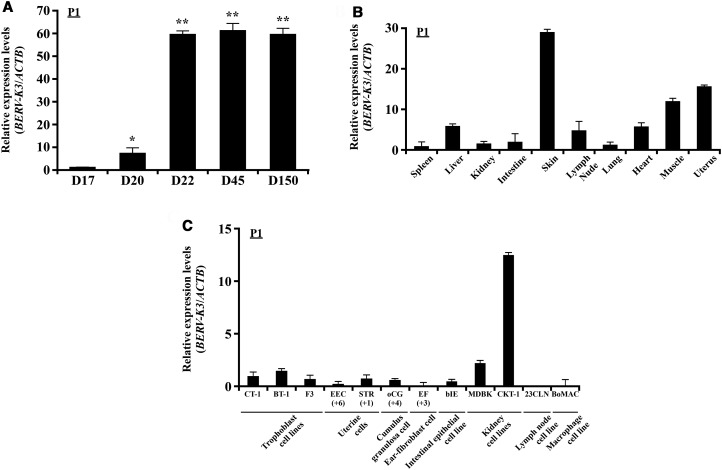
Figure 2. Expression of BERV-K3 transcript in bovine conceptuses and various tissues and cell lines.
(A) Changes in BERV-K3 expression. Using primer set P1 described in Figure 1B, expression levels of transcript were determined in day 17, 20, and 22 (D17, D20, and D22) conceptuses (n = 4, each day) and day 45 and 150 cotyledons (n = 3, each day). RNAs from four or three of conceptuses or cotyledons, respectively, were used to perform the qPCR analysis. Data are expressed as fold difference relative to its expression on D17. *, **Statistically significant differences in mRNA levels (P < 0.05 or P < 0.01, respectively) when compared with that in D17. (B) BERV-K3 expression in various tissues. BERV-K3 transcripts in various tissues of day 150 pregnant animals, except that uterine sample was harvested from nonpregnant Japanese black cattle. RNAs were extracted from the spleen, liver, kidney, intestine, skin, lymph node, lung, heart, muscle, and uterus (cyclic) (n = 3 each). Muscle and skin were taken from the upper left hind leg area. Data are expressed as fold difference relative to the expression in the spleen. (C) BERV-K3 expression in bovine cell lines. BERV-K3 transcripts in cultured bovine primary cells and cell lines. CT-1, BT-1, and F3 are bovine trophoblast cell lines. Primary uterine cells (EPI and STR; indicated passage times below), primary cumulus-granulosa cell (oCG; indicated passage times below), primary ear-fibroblast cell (EF; indicated passage times below), intestinal epithelial cell line (bIE), kidney cell lines (MDBK and CKT-1), lymph node cell line (23CLN), and macrophage cell line (BoMAC) were subjected to the present study. Three samples each were used and three independent experiments were conducted. Data are expressed as fold difference relative to the expression in CT-1.

