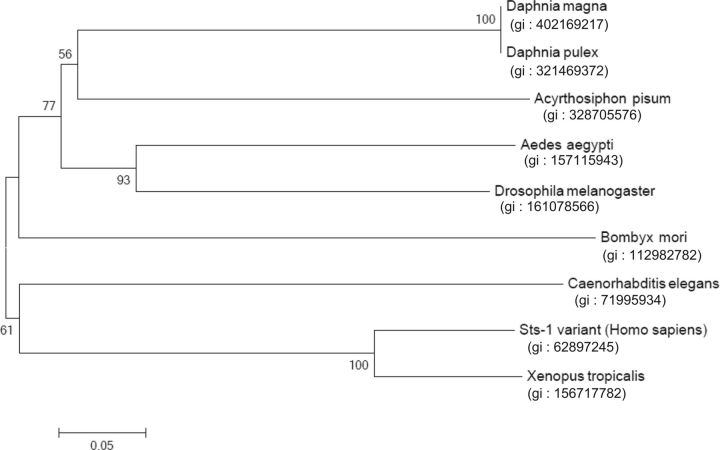
Fig. 5.
Phylogenetic tree of the amino acid sequences for the EPPase histidine phosphatase domains in D. magna and other species. Bootstrap values for 1,000 replicate analyses are shown at the branching points. The bar indicates branch length and corresponds to the mean number of differences ( P < 0.05) per residue along each branch.

