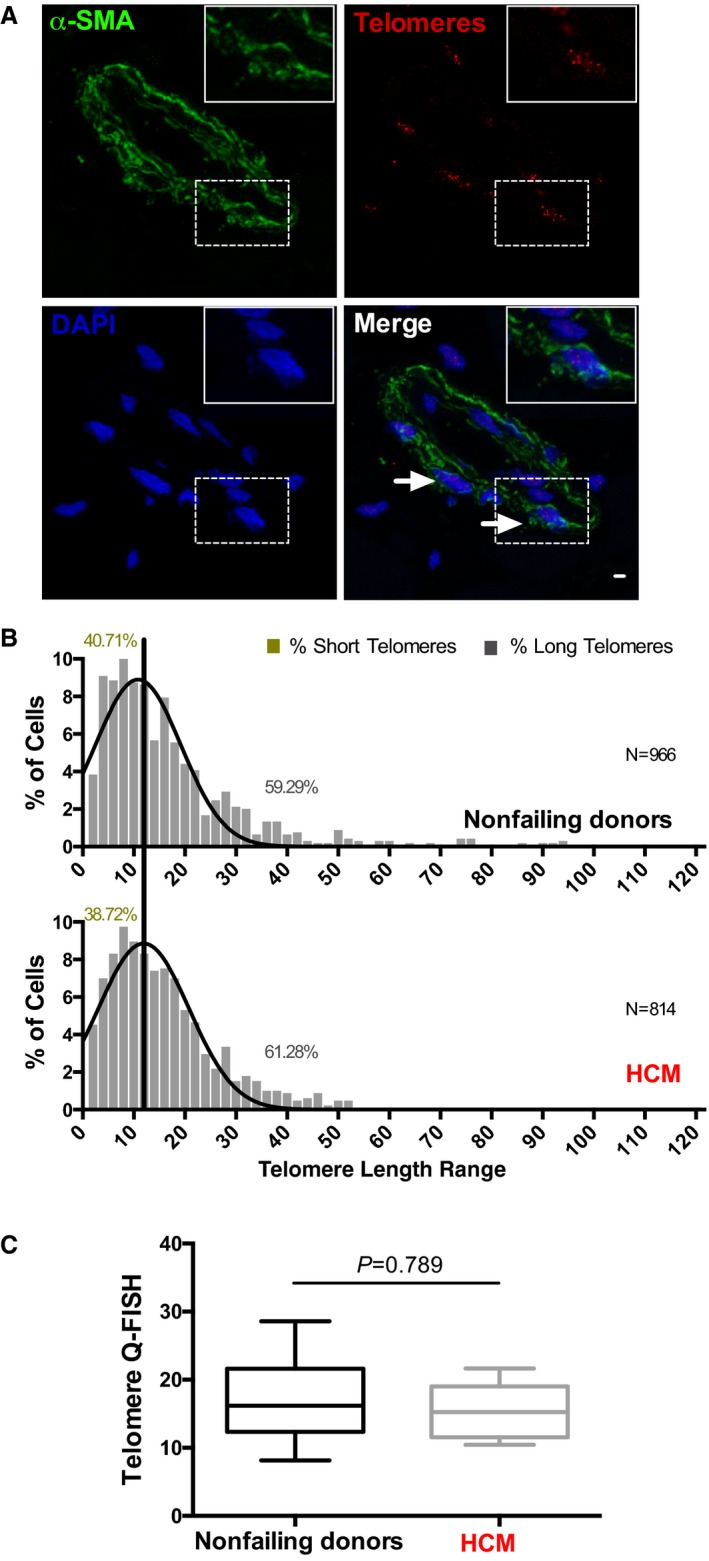
Figure 2.

Cardiac smooth muscle cells have comparable telomere lengths in nonfailing donor (NFD) and hypertrophic cardiomyopathy (HCM) hearts. A, Representative picture of left ventricular tissues subjected to quantitative fluorescence in situ hybridization (Q‐FISH) analysis and immunostained for smooth muscle actin cell marker (α‐smooth muscle actin [α‐SMA]), telomeres, and 4′,6‐diamidino‐2‐phenylindole (DAPI) shown in green, red, and blue, respectively. Scale bar, 20 μm. Arrowheads indicate representative analyzed α‐SMA + cells. Insert shows a higher magnification of an α‐SMA + cell. B, Telomere length distribution histogram analysis of α‐SMA + cells from NFDs and HCM patient cardiac samples. Data are presented as percentage of cells within the patients' spectrum of telomeric length range. A black vertical line was drawn at the median value of the histogram obtained for NFDs. Statistical comparison of NFDs and patients with HCM, Wilcoxon rank sum test, P=0.322. N indicates the number of cardiomyocytes scored (see also Table 2). The percentage of cells with short and long telomeres is shown in the graph. C, Boxplot analysis shows average telomere length measurements between NFDs and patients with HCM (Mann–Whitney test, P=0.798). A total of 26 NFDs and 17 patients with HCM were analyzed.
