
Figure 5.
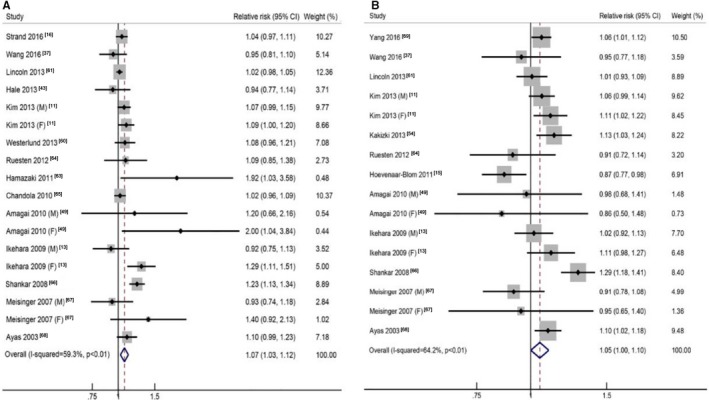
The forest plots between sleep duration (per hour) and risk of coronary heart disease for short sleep (A) and long sleep (B). CI indicates confidence interval.
Official websites use .gov
A
.gov website belongs to an official
government organization in the United States.
Secure .gov websites use HTTPS
A lock (
) or https:// means you've safely
connected to the .gov website. Share sensitive
information only on official, secure websites.
The forest plots between sleep duration (per hour) and risk of coronary heart disease for short sleep (A) and long sleep (B). CI indicates confidence interval.