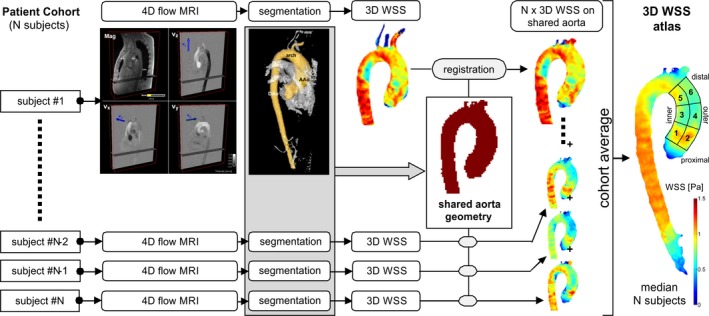
Figure 1.

Data analysis workflow for the calculation of a cohort specific 3D wall shear stress (WSS) atlas. WSS quantification was performed in the numbered regions of interest: (1) the inner sinotubular junction, (2) the outer sinotubular junction, (3) the inner proximal ascending aorta (AAo), (4) the outer proximal AAo, (5) the inner distal AAo, and (6) the outer distal AAo. 3D indicates 3‐dimensional; 4D, 4‐dimensional; MRI, magnetic resonance imaging.
