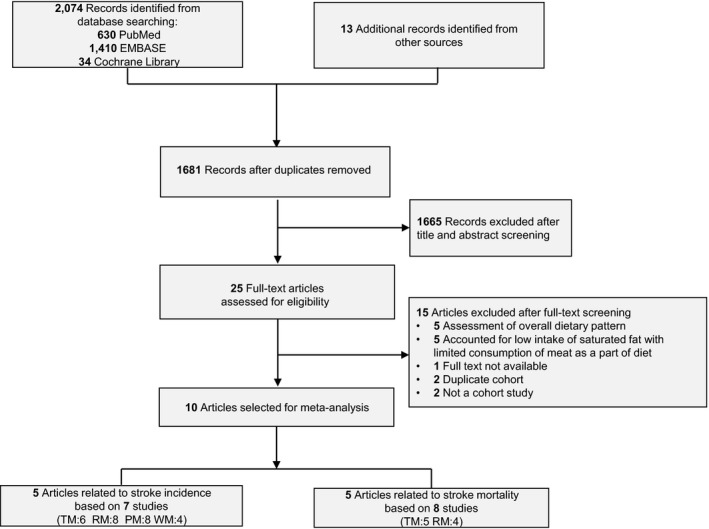
Figure 1.

Flow diagram for identification and study selection. PM indicates processed meat; RM, red meat; TM, total meat; WM, white meat. The numbers in parentheses refer to the number of comparisons within the studies according to types of meat.

Flow diagram for identification and study selection. PM indicates processed meat; RM, red meat; TM, total meat; WM, white meat. The numbers in parentheses refer to the number of comparisons within the studies according to types of meat.