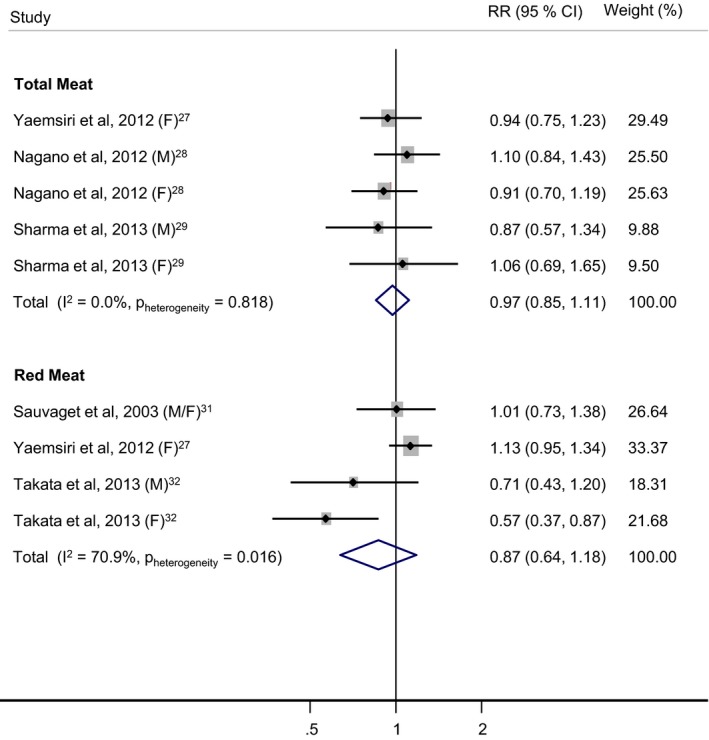
Figure 3.

Total and red meat consumption and relative risk (RR) of stroke mortality (highest vs lowest category). Weights are assigned from random‐effects model. CI indicates confidence interval; F, female; M, male.

Total and red meat consumption and relative risk (RR) of stroke mortality (highest vs lowest category). Weights are assigned from random‐effects model. CI indicates confidence interval; F, female; M, male.