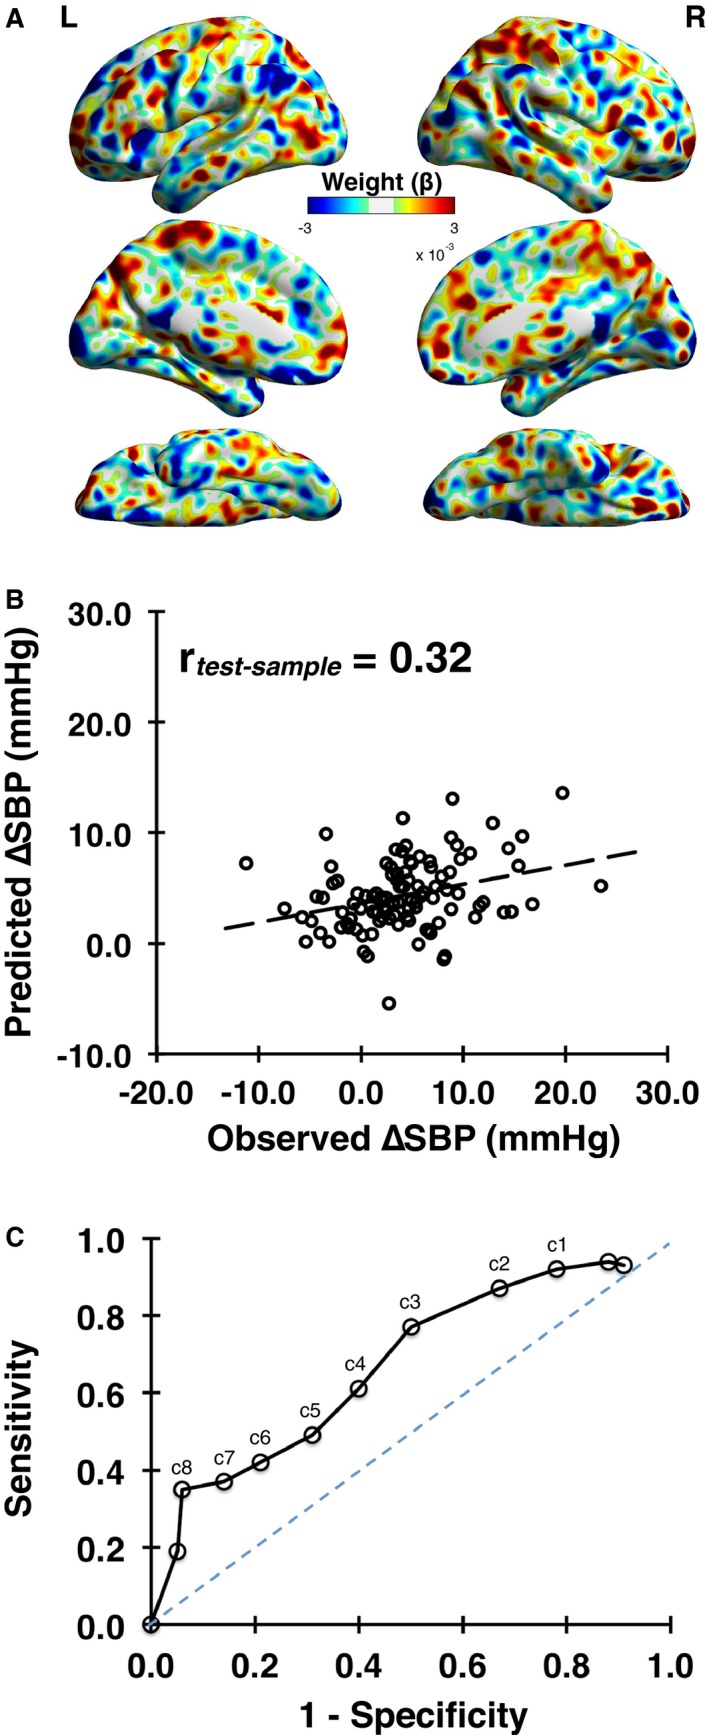
Figure 3.

The final whole‐brain and multivariate predictive model (weight map, ) is shown in (A). A comparison of predicted vs observed stressor‐evoked systolic blood pressure (SBP) reactivity (ΔSBP) in cross‐validation using the independent test sample of N=104 (not used in training) is shown in (B), r=0.32, P=0.001. C, A receiver operating characteristic curve illustrating the sensitivity and specificity of the whole‐brain multivariate pattern in predicting different cut‐off values (labeled as c) of stressor‐evoked SBP reactivity (ΔSBP in mm Hg) across individuals in the test sample of N=104. For example, c4 corresponds to ΔSBP of 4 mm Hg.
