Figure 2.

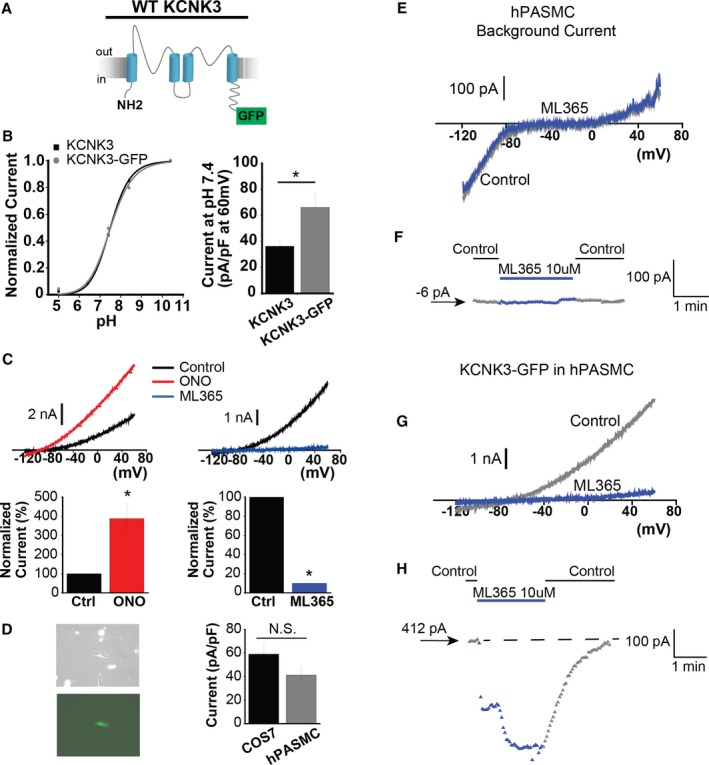
KCNK3 expression platform in human pulmonary artery smooth muscle cells (hPASMCs). A, KCNK3, tagged with GFP at the C‐terminus, was engineered (KCNK3‐GFP). B, KCNK3‐GFP (gray curve) vs KCNK3 (black curve) expression in COS7 cells across a broad pH range, with current normalized to max current at pH 10.4 (n=9–25 cells per pH data point for KCNK3; n=9–12 cells for KCNK3‐GFP; fitted by the Hill equation. C, KCNK3‐GFP is activated by ONO‐RS‐082 (ONO) 10 μmol/L (red trace, left) and inhibited by ML365 10 μmol/L (blue trace, right), under voltage‐clamp shown in COS7 cells. Predrug (control, black traces) and drug conditions are at pH 7.4. Bar graphs (bottom) show percent change in current at −50 mV after ONO (n=8 cells) or ML365 (n=12 cells) application, compared with control. D, Cultured hPASMCs (left, top) expressing KCNK3‐GFP fluoresce green (left, bottom). Bar graph (right) shows KCNK3‐GFP current activity at pH 7.4 (pA/pF at 60 mV) in hPASMCs (gray, n=20 cells) vs COS7 cells (black, n=26 cells). E, Background hPASMC current at pH 7.4 (control, gray trace), and after application of ML365 10 μmol/L (blue trace). F, Sample ML365 time course of action in control and drug conditions, measured at −50 mV, from a starting current amplitude of −6 pA indicated by the arrow. G, Current from hPASMC expressing KCNK3‐GFP is shown at pH 7.4 (control, gray trace), and in ML365 10 μmol/L (blue trace). H, Sample ML365 time course of action in control and drug conditions, measured at −50 mV, from a starting current amplitude of 412 pA indicated by the arrow. Horizontal dashed line is drawn at the starting level of current in control solution. Bar graphs show mean±SEM. *P<0.05 by the paired (B) and unpaired (C) Student t test. N.S. indicates no significant difference.
