Figure 3.

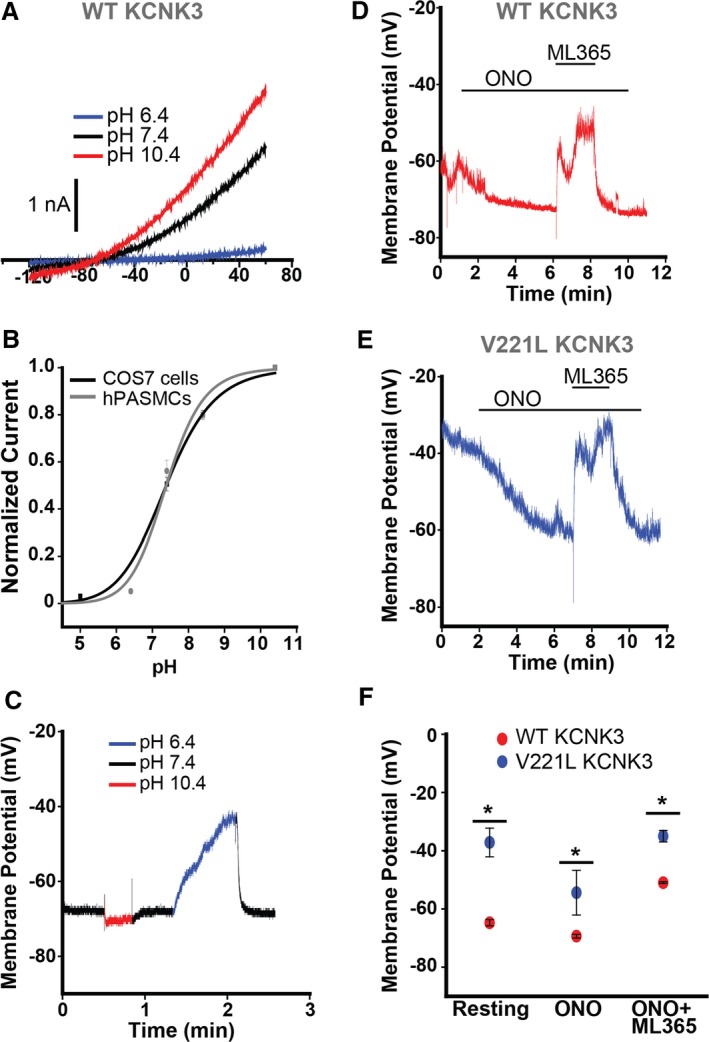
Robust response of KCNK3 channels to pH changes and pharmacological modulators in human pulmonary artery smooth muscle cells (hPASMCs). A, Voltage clamp recording of KCNK3‐GFP expressed in hPASMCs at pH 6.4 (blue), pH 7.4 (black), and pH 10.4 (red). B, KCNK3‐GFP expression in hPASMCs (gray curve) vs COS7 cells (black curve) across a broad pH range, with current normalized to max current at pH 10.4 (n=9–12 cells per pH data point in COS7; n=2–6 cells per pH data point in hPASMCs; fitted by the Hill equation). C, Current clamp recording of wildtype (WT) KCNK3‐GFP, with changes in membrane potential (mV) measured at pH 6.4 (blue), pH 7.4 (black), and pH 10.4 (red). D, Current clamp recording of WT KCNK3‐GFP (red trace), showing changes in membrane potential (mV) upon application of ONO‐RS‐082 (ONO), ONO+ML365, or pH 8.4. E, Current clamp recording of V221L KCNK3‐GFP (blue trace), showing changes in membrane potential (mV) upon application of ONO, or ONO+ML365. F, Current clamp summary of WT (red) and V221L (blue) KCNK3‐GFP for resting potential, ONO, and ONO+ML365 conditions (n=3–11 cells per condition). Drugs applied at a concentration of 10 μmol/L in all experiments. Data plots represent means±SEM. *P<0.05 by the unpaired Student t test.
